

2.3 Results and Discussion
47
4
5
6
7
8
0
5
10
15
20
25
8.49
11.81
14.24
19.65
20.01
f (Hz)
n
b
(-)
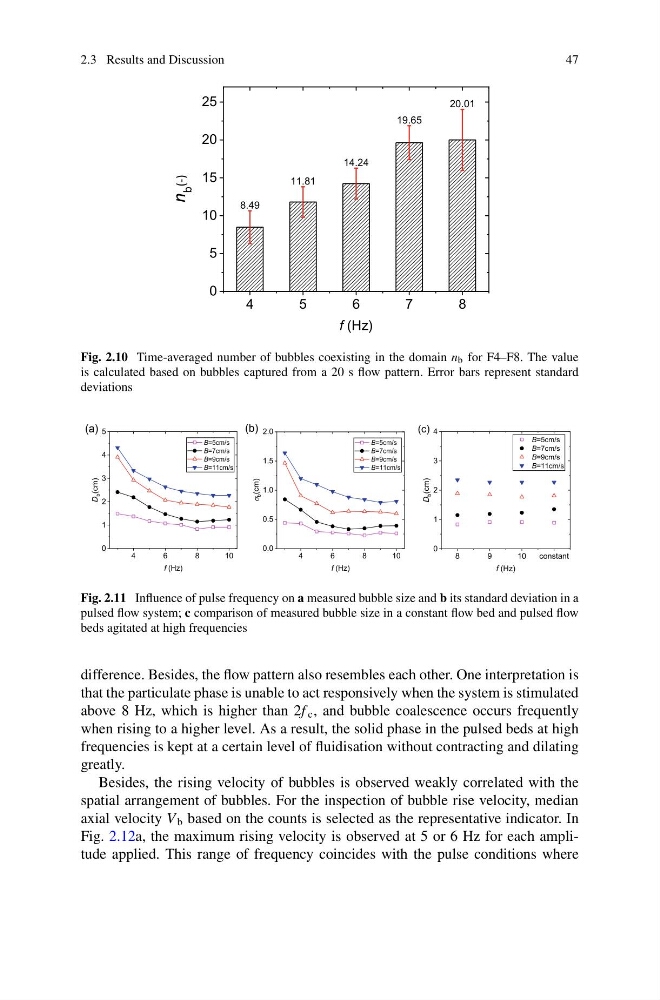
Fig. 2.10 Time-averaged number of bubbles coexisting in the domain n b for F4–F8. The value
is calculated based on bubbles captured from a 20 s flow pattern. Error bars represent standard
deviations
Fig. 2.11 Influence of pulse frequency on a measured bubble size and b its standard deviation in a
pulsed flow system; c comparison of measured bubble size in a constant flow bed and pulsed flow
beds agitated at high frequencies
difference. Besides, the flow pattern also resembles each other. One interpretation is
that the particulate phase is unable to act responsively when the system is stimulated
above 8 Hz, which is higher than 2f c , and bubble coalescence occurs frequently
when rising to a higher level. As a result, the solid phase in the pulsed beds at high
frequencies is kept at a certain level of fluidisation without contracting and dilating
greatly.
Besides, the rising velocity of bubbles is observed weakly correlated with the
spatial arrangement of bubbles. For the inspection of bubble rise velocity, median
axial velocity V b based on the counts is selected as the representative indicator. In
Fig. 2.12a, the maximum rising velocity is observed at 5 or 6 Hz for each amplitude applied. This range of frequency coincides with the pulse conditions where
47
4
5
6
7
8
0
5
10
15
20
25
8.49
11.81
14.24
19.65
20.01
f (Hz)
n
b
(-)
Fig. 2.10 Time-averaged number of bubbles coexisting in the domain n b for F4–F8. The value
is calculated based on bubbles captured from a 20 s flow pattern. Error bars represent standard
deviations
Fig. 2.11 Influence of pulse frequency on a measured bubble size and b its standard deviation in a
pulsed flow system; c comparison of measured bubble size in a constant flow bed and pulsed flow
beds agitated at high frequencies
difference. Besides, the flow pattern also resembles each other. One interpretation is
that the particulate phase is unable to act responsively when the system is stimulated
above 8 Hz, which is higher than 2f c , and bubble coalescence occurs frequently
when rising to a higher level. As a result, the solid phase in the pulsed beds at high
frequencies is kept at a certain level of fluidisation without contracting and dilating
greatly.
Besides, the rising velocity of bubbles is observed weakly correlated with the
spatial arrangement of bubbles. For the inspection of bubble rise velocity, median
axial velocity V b based on the counts is selected as the representative indicator. In
Fig. 2.12a, the maximum rising velocity is observed at 5 or 6 Hz for each amplitude applied. This range of frequency coincides with the pulse conditions where