

46
2 Bubbling Properties in Pulsed Fluidised Beds
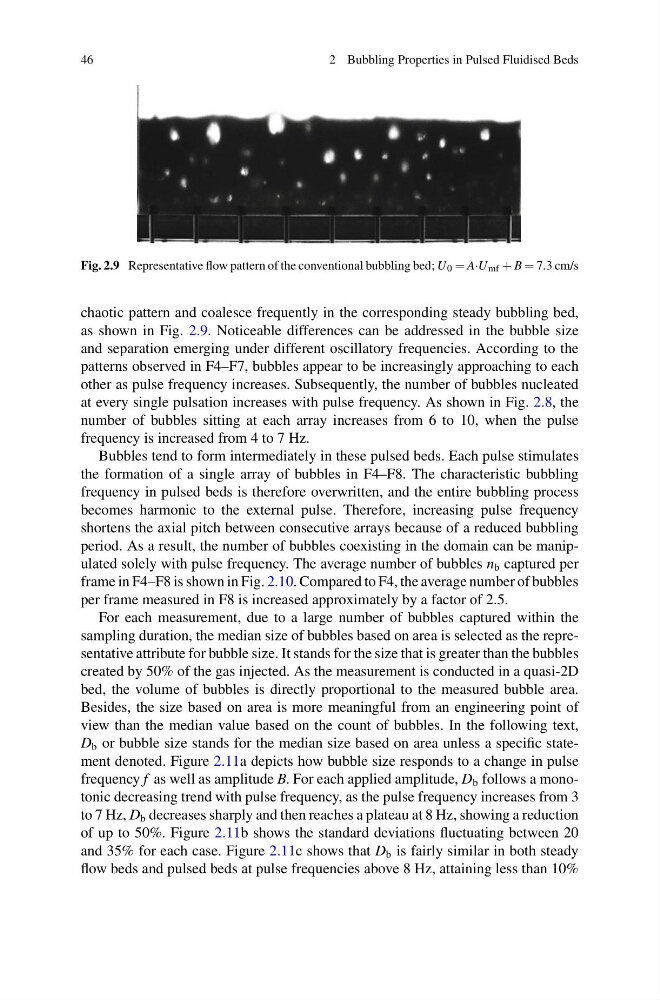
Fig. 2.9 Representative flow pattern of the conventional bubbling bed; U 0 = A·U mf + B = 7.3 cm/s
chaotic pattern and coalesce frequently in the corresponding steady bubbling bed,
as shown in Fig. 2.9. Noticeable differences can be addressed in the bubble size
and separation emerging under different oscillatory frequencies. According to the
patterns observed in F4–F7, bubbles appear to be increasingly approaching to each
other as pulse frequency increases. Subsequently, the number of bubbles nucleated
at every single pulsation increases with pulse frequency. As shown in Fig. 2.8, the
number of bubbles sitting at each array increases from 6 to 10, when the pulse
frequency is increased from 4 to 7 Hz.
Bubbles tend to form intermediately in these pulsed beds. Each pulse stimulates
the formation of a single array of bubbles in F4–F8. The characteristic bubbling
frequency in pulsed beds is therefore overwritten, and the entire bubbling process
becomes harmonic to the external pulse. Therefore, increasing pulse frequency
shortens the axial pitch between consecutive arrays because of a reduced bubbling
period. As a result, the number of bubbles coexisting in the domain can be manipulated solely with pulse frequency. The average number of bubbles n b captured per
frame in F4–F8 is shown in Fig. 2.10. Compared to F4, the average number of bubbles
per frame measured in F8 is increased approximately by a factor of 2.5.
For each measurement, due to a large number of bubbles captured within the
sampling duration, the median size of bubbles based on area is selected as the representative attribute for bubble size. It stands for the size that is greater than the bubbles
created by 50% of the gas injected. As the measurement is conducted in a quasi-2D
bed, the volume of bubbles is directly proportional to the measured bubble area.
Besides, the size based on area is more meaningful from an engineering point of
view than the median value based on the count of bubbles. In the following text,
D b or bubble size stands for the median size based on area unless a specific statement denoted. Figure 2.11a depicts how bubble size responds to a change in pulse
frequency f as well as amplitude B. For each applied amplitude, D b follows a monotonic decreasing trend with pulse frequency, as the pulse frequency increases from 3
to 7 Hz, D b decreases sharply and then reaches a plateau at 8 Hz, showing a reduction
of up to 50%. Figure 2.11b shows the standard deviations fluctuating between 20
and 35% for each case. Figure 2.11c shows that D b is fairly similar in both steady
flow beds and pulsed beds at pulse frequencies above 8 Hz, attaining less than 10%
2 Bubbling Properties in Pulsed Fluidised Beds
Fig. 2.9 Representative flow pattern of the conventional bubbling bed; U 0 = A·U mf + B = 7.3 cm/s
chaotic pattern and coalesce frequently in the corresponding steady bubbling bed,
as shown in Fig. 2.9. Noticeable differences can be addressed in the bubble size
and separation emerging under different oscillatory frequencies. According to the
patterns observed in F4–F7, bubbles appear to be increasingly approaching to each
other as pulse frequency increases. Subsequently, the number of bubbles nucleated
at every single pulsation increases with pulse frequency. As shown in Fig. 2.8, the
number of bubbles sitting at each array increases from 6 to 10, when the pulse
frequency is increased from 4 to 7 Hz.
Bubbles tend to form intermediately in these pulsed beds. Each pulse stimulates
the formation of a single array of bubbles in F4–F8. The characteristic bubbling
frequency in pulsed beds is therefore overwritten, and the entire bubbling process
becomes harmonic to the external pulse. Therefore, increasing pulse frequency
shortens the axial pitch between consecutive arrays because of a reduced bubbling
period. As a result, the number of bubbles coexisting in the domain can be manipulated solely with pulse frequency. The average number of bubbles n b captured per
frame in F4–F8 is shown in Fig. 2.10. Compared to F4, the average number of bubbles
per frame measured in F8 is increased approximately by a factor of 2.5.
For each measurement, due to a large number of bubbles captured within the
sampling duration, the median size of bubbles based on area is selected as the representative attribute for bubble size. It stands for the size that is greater than the bubbles
created by 50% of the gas injected. As the measurement is conducted in a quasi-2D
bed, the volume of bubbles is directly proportional to the measured bubble area.
Besides, the size based on area is more meaningful from an engineering point of
view than the median value based on the count of bubbles. In the following text,
D b or bubble size stands for the median size based on area unless a specific statement denoted. Figure 2.11a depicts how bubble size responds to a change in pulse
frequency f as well as amplitude B. For each applied amplitude, D b follows a monotonic decreasing trend with pulse frequency, as the pulse frequency increases from 3
to 7 Hz, D b decreases sharply and then reaches a plateau at 8 Hz, showing a reduction
of up to 50%. Figure 2.11b shows the standard deviations fluctuating between 20
and 35% for each case. Figure 2.11c shows that D b is fairly similar in both steady
flow beds and pulsed beds at pulse frequencies above 8 Hz, attaining less than 10%