

2.3 Results and Discussion
45
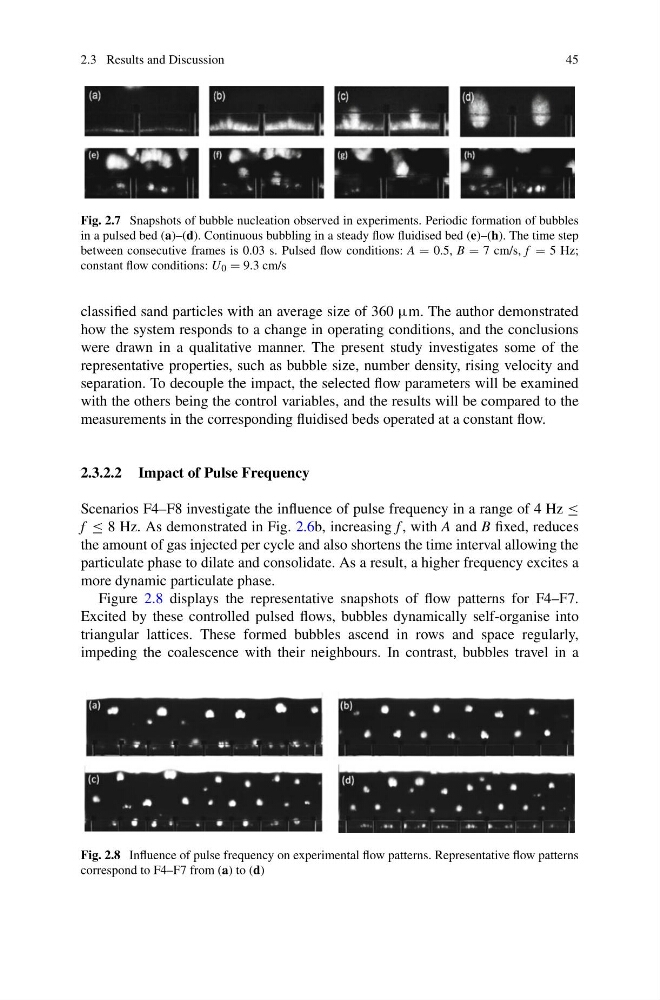
Fig. 2.7 Snapshots of bubble nucleation observed in experiments. Periodic formation of bubbles
in a pulsed bed (a)–(d). Continuous bubbling in a steady flow fluidised bed (e)–(h). The time step
between consecutive frames is 0.03 s. Pulsed flow conditions: A = 0.5, B = 7 cm/s, f = 5 Hz;
constant flow conditions: U 0 = 9.3 cm/s
classified sand particles with an average size of 360 μm. The author demonstrated
how the system responds to a change in operating conditions, and the conclusions
were drawn in a qualitative manner. The present study investigates some of the
representative properties, such as bubble size, number density, rising velocity and
separation. To decouple the impact, the selected flow parameters will be examined
with the others being the control variables, and the results will be compared to the
measurements in the corresponding fluidised beds operated at a constant flow.
2.3.2.2 Impact of Pulse Frequency
Scenarios F4–F8 investigate the influence of pulse frequency in a range of 4 Hz ≤
f ≤ 8 Hz. As demonstrated in Fig. 2.6b, increasing f , with A and B fixed, reduces
the amount of gas injected per cycle and also shortens the time interval allowing the
particulate phase to dilate and consolidate. As a result, a higher frequency excites a
more dynamic particulate phase.
Figure 2.8 displays the representative snapshots of flow patterns for F4–F7.
Excited by these controlled pulsed flows, bubbles dynamically self-organise into
triangular lattices. These formed bubbles ascend in rows and space regularly,
impeding the coalescence with their neighbours. In contrast, bubbles travel in a
Fig. 2.8 Influence of pulse frequency on experimental flow patterns. Representative flow patterns
correspond to F4–F7 from (a) to (d)
45
Fig. 2.7 Snapshots of bubble nucleation observed in experiments. Periodic formation of bubbles
in a pulsed bed (a)–(d). Continuous bubbling in a steady flow fluidised bed (e)–(h). The time step
between consecutive frames is 0.03 s. Pulsed flow conditions: A = 0.5, B = 7 cm/s, f = 5 Hz;
constant flow conditions: U 0 = 9.3 cm/s
classified sand particles with an average size of 360 μm. The author demonstrated
how the system responds to a change in operating conditions, and the conclusions
were drawn in a qualitative manner. The present study investigates some of the
representative properties, such as bubble size, number density, rising velocity and
separation. To decouple the impact, the selected flow parameters will be examined
with the others being the control variables, and the results will be compared to the
measurements in the corresponding fluidised beds operated at a constant flow.
2.3.2.2 Impact of Pulse Frequency
Scenarios F4–F8 investigate the influence of pulse frequency in a range of 4 Hz ≤
f ≤ 8 Hz. As demonstrated in Fig. 2.6b, increasing f , with A and B fixed, reduces
the amount of gas injected per cycle and also shortens the time interval allowing the
particulate phase to dilate and consolidate. As a result, a higher frequency excites a
more dynamic particulate phase.
Figure 2.8 displays the representative snapshots of flow patterns for F4–F7.
Excited by these controlled pulsed flows, bubbles dynamically self-organise into
triangular lattices. These formed bubbles ascend in rows and space regularly,
impeding the coalescence with their neighbours. In contrast, bubbles travel in a
Fig. 2.8 Influence of pulse frequency on experimental flow patterns. Representative flow patterns
correspond to F4–F7 from (a) to (d)