

136
5 The Role of Solid Mechanics in Stabilising Structured Flows
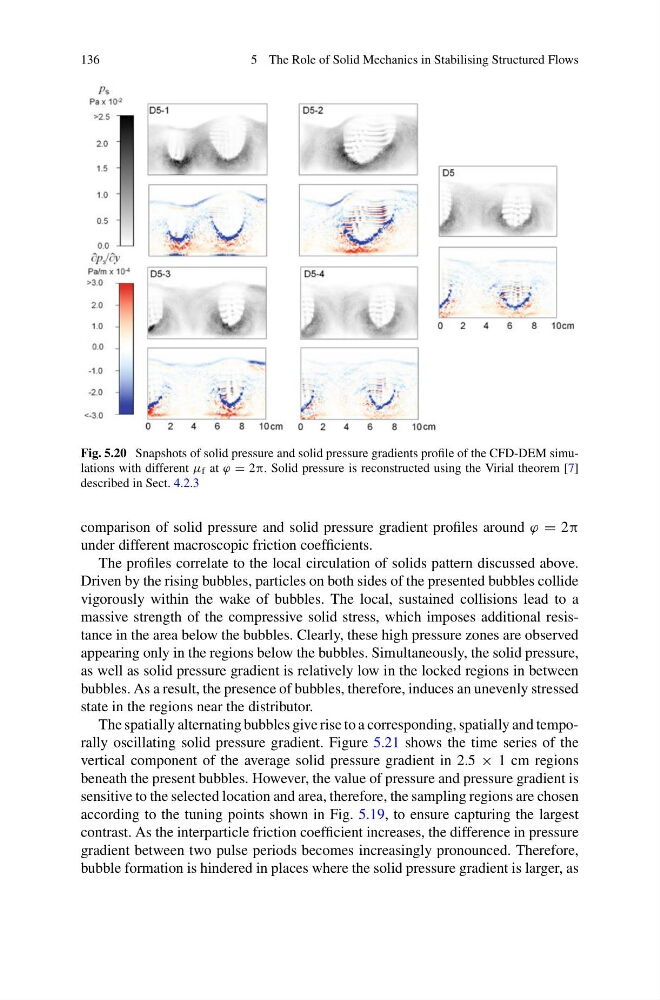
Fig. 5.20 Snapshots of solid pressure and solid pressure gradients profile of the CFD-DEM simulations with different μ f at ϕ = 2π. Solid pressure is reconstructed using the Virial theorem [7]
described in Sect. 4.2.3
comparison of solid pressure and solid pressure gradient profiles around ϕ = 2π
under different macroscopic friction coefficients.
The profiles correlate to the local circulation of solids pattern discussed above.
Driven by the rising bubbles, particles on both sides of the presented bubbles collide
vigorously within the wake of bubbles. The local, sustained collisions lead to a
massive strength of the compressive solid stress, which imposes additional resistance in the area below the bubbles. Clearly, these high pressure zones are observed
appearing only in the regions below the bubbles. Simultaneously, the solid pressure,
as well as solid pressure gradient is relatively low in the locked regions in between
bubbles. As a result, the presence of bubbles, therefore, induces an unevenly stressed
state in the regions near the distributor.
The spatially alternating bubbles give rise to a corresponding, spatially and temporally oscillating solid pressure gradient. Figure 5.21 shows the time series of the
vertical component of the average solid pressure gradient in 2.5 × 1 cm regions
beneath the present bubbles. However, the value of pressure and pressure gradient is
sensitive to the selected location and area, therefore, the sampling regions are chosen
according to the tuning points shown in Fig. 5.19, to ensure capturing the largest
contrast. As the interparticle friction coefficient increases, the difference in pressure
gradient between two pulse periods becomes increasingly pronounced. Therefore,
bubble formation is hindered in places where the solid pressure gradient is larger, as
5 The Role of Solid Mechanics in Stabilising Structured Flows
Fig. 5.20 Snapshots of solid pressure and solid pressure gradients profile of the CFD-DEM simulations with different μ f at ϕ = 2π. Solid pressure is reconstructed using the Virial theorem [7]
described in Sect. 4.2.3
comparison of solid pressure and solid pressure gradient profiles around ϕ = 2π
under different macroscopic friction coefficients.
The profiles correlate to the local circulation of solids pattern discussed above.
Driven by the rising bubbles, particles on both sides of the presented bubbles collide
vigorously within the wake of bubbles. The local, sustained collisions lead to a
massive strength of the compressive solid stress, which imposes additional resistance in the area below the bubbles. Clearly, these high pressure zones are observed
appearing only in the regions below the bubbles. Simultaneously, the solid pressure,
as well as solid pressure gradient is relatively low in the locked regions in between
bubbles. As a result, the presence of bubbles, therefore, induces an unevenly stressed
state in the regions near the distributor.
The spatially alternating bubbles give rise to a corresponding, spatially and temporally oscillating solid pressure gradient. Figure 5.21 shows the time series of the
vertical component of the average solid pressure gradient in 2.5 × 1 cm regions
beneath the present bubbles. However, the value of pressure and pressure gradient is
sensitive to the selected location and area, therefore, the sampling regions are chosen
according to the tuning points shown in Fig. 5.19, to ensure capturing the largest
contrast. As the interparticle friction coefficient increases, the difference in pressure
gradient between two pulse periods becomes increasingly pronounced. Therefore,
bubble formation is hindered in places where the solid pressure gradient is larger, as