

132
5 The Role of Solid Mechanics in Stabilising Structured Flows
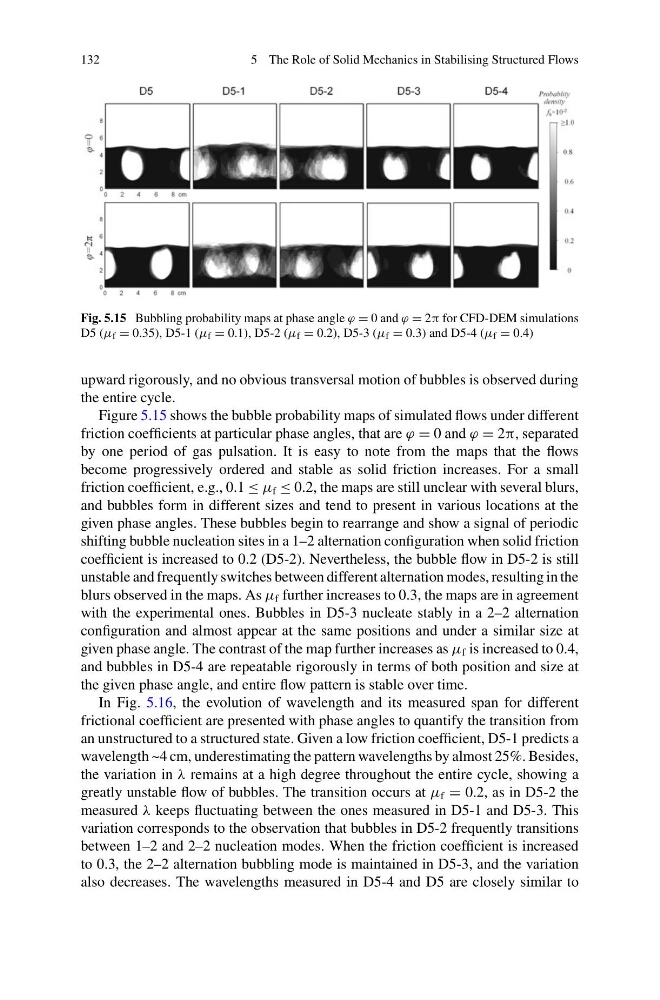
Fig. 5.15 Bubbling probability maps at phase angle ϕ = 0 and ϕ = 2π for CFD-DEM simulations
D5 (μ f = 0.35), D5-1 (μ f = 0.1), D5-2 (μ f = 0.2), D5-3 (μ f = 0.3) and D5-4 (μ f = 0.4)
upward rigorously, and no obvious transversal motion of bubbles is observed during
the entire cycle.
Figure 5.15 shows the bubble probability maps of simulated flows under different
friction coefficients at particular phase angles, that are ϕ = 0 and ϕ = 2π, separated
by one period of gas pulsation. It is easy to note from the maps that the flows
become progressively ordered and stable as solid friction increases. For a small
friction coefficient, e.g., 0.1 ≤ μ f ≤ 0.2, the maps are still unclear with several blurs,
and bubbles form in different sizes and tend to present in various locations at the
given phase angles. These bubbles begin to rearrange and show a signal of periodic
shifting bubble nucleation sites in a 1–2 alternation configuration when solid friction
coefficient is increased to 0.2 (D5-2). Nevertheless, the bubble flow in D5-2 is still
unstable and frequently switches between different alternation modes, resulting in the
blurs observed in the maps. As μ f further increases to 0.3, the maps are in agreement
with the experimental ones. Bubbles in D5-3 nucleate stably in a 2–2 alternation
configuration and almost appear at the same positions and under a similar size at
given phase angle. The contrast of the map further increases as μ f is increased to 0.4,
and bubbles in D5-4 are repeatable rigorously in terms of both position and size at
the given phase angle, and entire flow pattern is stable over time.
In Fig. 5.16, the evolution of wavelength and its measured span for different
frictional coefficient are presented with phase angles to quantify the transition from
an unstructured to a structured state. Given a low friction coefficient, D5-1 predicts a
wavelength ~4 cm, underestimating the pattern wavelengths by almost 25%. Besides,
the variation in λ remains at a high degree throughout the entire cycle, showing a
greatly unstable flow of bubbles. The transition occurs at μ f = 0.2, as in D5-2 the
measured λ keeps fluctuating between the ones measured in D5-1 and D5-3. This
variation corresponds to the observation that bubbles in D5-2 frequently transitions
between 1–2 and 2–2 nucleation modes. When the friction coefficient is increased
to 0.3, the 2–2 alternation bubbling mode is maintained in D5-3, and the variation
also decreases. The wavelengths measured in D5-4 and D5 are closely similar to
5 The Role of Solid Mechanics in Stabilising Structured Flows
Fig. 5.15 Bubbling probability maps at phase angle ϕ = 0 and ϕ = 2π for CFD-DEM simulations
D5 (μ f = 0.35), D5-1 (μ f = 0.1), D5-2 (μ f = 0.2), D5-3 (μ f = 0.3) and D5-4 (μ f = 0.4)
upward rigorously, and no obvious transversal motion of bubbles is observed during
the entire cycle.
Figure 5.15 shows the bubble probability maps of simulated flows under different
friction coefficients at particular phase angles, that are ϕ = 0 and ϕ = 2π, separated
by one period of gas pulsation. It is easy to note from the maps that the flows
become progressively ordered and stable as solid friction increases. For a small
friction coefficient, e.g., 0.1 ≤ μ f ≤ 0.2, the maps are still unclear with several blurs,
and bubbles form in different sizes and tend to present in various locations at the
given phase angles. These bubbles begin to rearrange and show a signal of periodic
shifting bubble nucleation sites in a 1–2 alternation configuration when solid friction
coefficient is increased to 0.2 (D5-2). Nevertheless, the bubble flow in D5-2 is still
unstable and frequently switches between different alternation modes, resulting in the
blurs observed in the maps. As μ f further increases to 0.3, the maps are in agreement
with the experimental ones. Bubbles in D5-3 nucleate stably in a 2–2 alternation
configuration and almost appear at the same positions and under a similar size at
given phase angle. The contrast of the map further increases as μ f is increased to 0.4,
and bubbles in D5-4 are repeatable rigorously in terms of both position and size at
the given phase angle, and entire flow pattern is stable over time.
In Fig. 5.16, the evolution of wavelength and its measured span for different
frictional coefficient are presented with phase angles to quantify the transition from
an unstructured to a structured state. Given a low friction coefficient, D5-1 predicts a
wavelength ~4 cm, underestimating the pattern wavelengths by almost 25%. Besides,
the variation in λ remains at a high degree throughout the entire cycle, showing a
greatly unstable flow of bubbles. The transition occurs at μ f = 0.2, as in D5-2 the
measured λ keeps fluctuating between the ones measured in D5-1 and D5-3. This
variation corresponds to the observation that bubbles in D5-2 frequently transitions
between 1–2 and 2–2 nucleation modes. When the friction coefficient is increased
to 0.3, the 2–2 alternation bubbling mode is maintained in D5-3, and the variation
also decreases. The wavelengths measured in D5-4 and D5 are closely similar to