

5.5 Results and Discussion
129
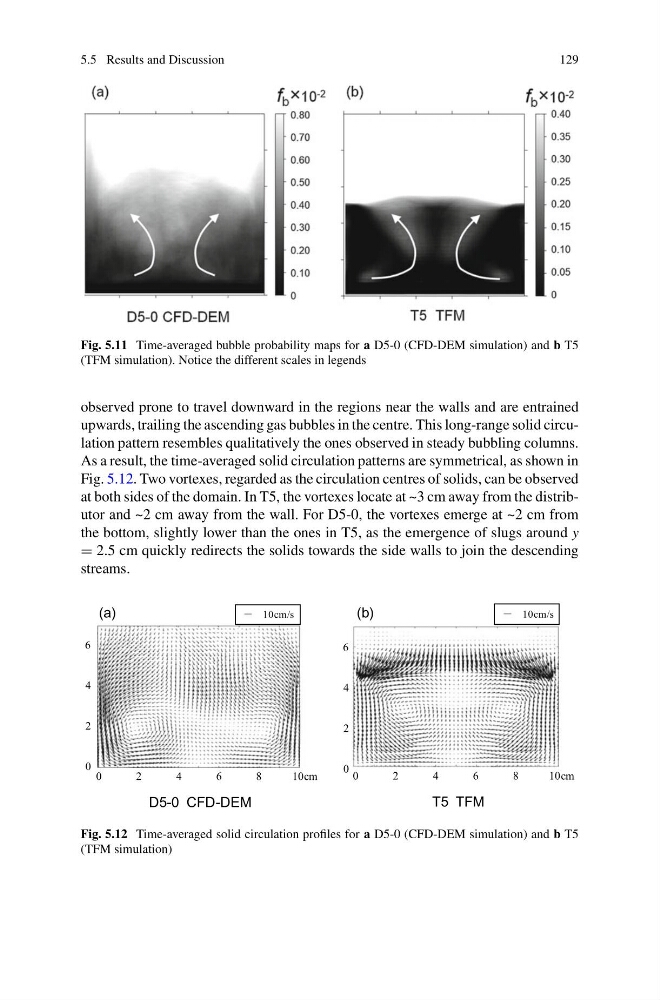
Fig. 5.11 Time-averaged bubble probability maps for a D5-0 (CFD-DEM simulation) and b T5
(TFM simulation). Notice the different scales in legends
observed prone to travel downward in the regions near the walls and are entrained
upwards, trailing the ascending gas bubbles in the centre. This long-range solid circulation pattern resembles qualitatively the ones observed in steady bubbling columns.
As a result, the time-averaged solid circulation patterns are symmetrical, as shown in
Fig. 5.12. Two vortexes, regarded as the circulation centres of solids, can be observed
at both sides of the domain. In T5, the vortexes locate at ~3 cm away from the distributor and ~2 cm away from the wall. For D5-0, the vortexes emerge at ~2 cm from
the bottom, slightly lower than the ones in T5, as the emergence of slugs around y
= 2.5 cm quickly redirects the solids towards the side walls to join the descending
streams.
T5 TFM
0
2
4
6
8
1 0 c m
D5-0 CFD-DEM
0
2
4
6
0
2
4
6
8
1 0 c m
10cm/s
10cm/s
0
2
4
6
(a)
(b)
Fig. 5.12 Time-averaged solid circulation profiles for a D5-0 (CFD-DEM simulation) and b T5
(TFM simulation)
129
Fig. 5.11 Time-averaged bubble probability maps for a D5-0 (CFD-DEM simulation) and b T5
(TFM simulation). Notice the different scales in legends
observed prone to travel downward in the regions near the walls and are entrained
upwards, trailing the ascending gas bubbles in the centre. This long-range solid circulation pattern resembles qualitatively the ones observed in steady bubbling columns.
As a result, the time-averaged solid circulation patterns are symmetrical, as shown in
Fig. 5.12. Two vortexes, regarded as the circulation centres of solids, can be observed
at both sides of the domain. In T5, the vortexes locate at ~3 cm away from the distributor and ~2 cm away from the wall. For D5-0, the vortexes emerge at ~2 cm from
the bottom, slightly lower than the ones in T5, as the emergence of slugs around y
= 2.5 cm quickly redirects the solids towards the side walls to join the descending
streams.
T5 TFM
0
2
4
6
8
1 0 c m
D5-0 CFD-DEM
0
2
4
6
0
2
4
6
8
1 0 c m
10cm/s
10cm/s
0
2
4
6
(a)
(b)
Fig. 5.12 Time-averaged solid circulation profiles for a D5-0 (CFD-DEM simulation) and b T5
(TFM simulation)