

128
5 The Role of Solid Mechanics in Stabilising Structured Flows
5.5.4 Flow Behaviour of Frictionless Particles in Pulsed Beds
The discrepancies of flow patterns created by TFM and CFD-DEM can be mainly
attributed to the representation of solid friction effects. To evaluate the difference, the
frictional particles in D5 are substituted with frictionless particles by assigning μ f =
0 in CFD-DEM. As a result, under the same pulsation, the simulated flow patterns
in a system of frictionless particles is entirely different from the ones observed with
frictional particles.
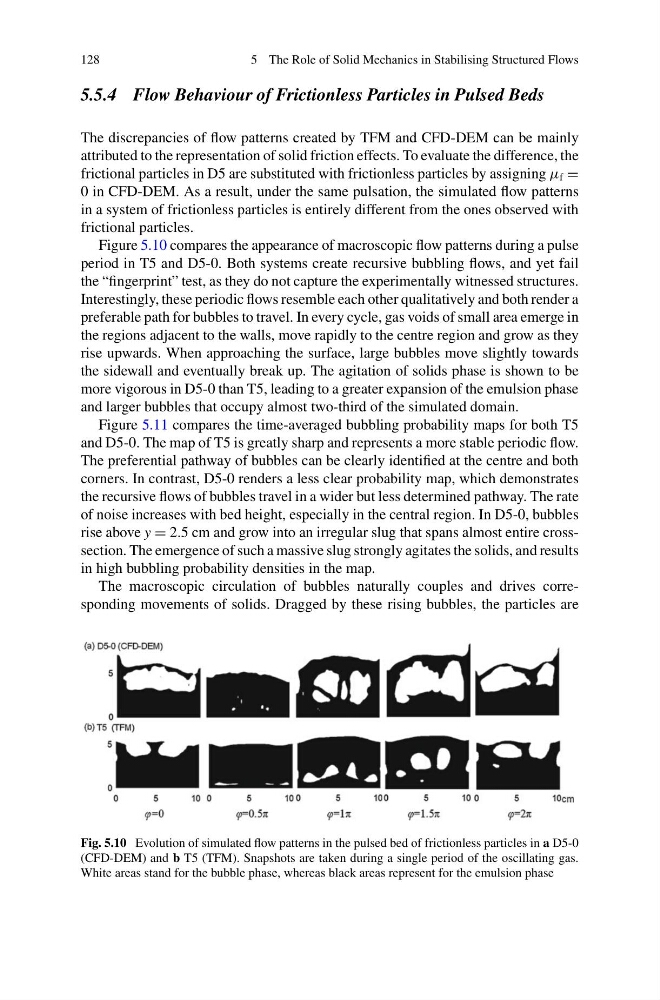
Figure 5.10 compares the appearance of macroscopic flow patterns during a pulse
period in T5 and D5-0. Both systems create recursive bubbling flows, and yet fail
the “fingerprint” test, as they do not capture the experimentally witnessed structures.
Interestingly, these periodic flows resemble each other qualitatively and both render a
preferable path for bubbles to travel. In every cycle, gas voids of small area emerge in
the regions adjacent to the walls, move rapidly to the centre region and grow as they
rise upwards. When approaching the surface, large bubbles move slightly towards
the sidewall and eventually break up. The agitation of solids phase is shown to be
more vigorous in D5-0 than T5, leading to a greater expansion of the emulsion phase
and larger bubbles that occupy almost two-third of the simulated domain.
Figure 5.11 compares the time-averaged bubbling probability maps for both T5
and D5-0. The map of T5 is greatly sharp and represents a more stable periodic flow.
The preferential pathway of bubbles can be clearly identified at the centre and both
corners. In contrast, D5-0 renders a less clear probability map, which demonstrates
the recursive flows of bubbles travel in a wider but less determined pathway. The rate
of noise increases with bed height, especially in the central region. In D5-0, bubbles
rise above y = 2.5 cm and grow into an irregular slug that spans almost entire crosssection. The emergence of such a massive slug strongly agitates the solids, and results
in high bubbling probability densities in the map.
The macroscopic circulation of bubbles naturally couples and drives corresponding movements of solids. Dragged by these rising bubbles, the particles are
Fig. 5.10 Evolution of simulated flow patterns in the pulsed bed of frictionless particles in a D5-0
(CFD-DEM) and b T5 (TFM). Snapshots are taken during a single period of the oscillating gas.
White areas stand for the bubble phase, whereas black areas represent for the emulsion phase
5 The Role of Solid Mechanics in Stabilising Structured Flows
5.5.4 Flow Behaviour of Frictionless Particles in Pulsed Beds
The discrepancies of flow patterns created by TFM and CFD-DEM can be mainly
attributed to the representation of solid friction effects. To evaluate the difference, the
frictional particles in D5 are substituted with frictionless particles by assigning μ f =
0 in CFD-DEM. As a result, under the same pulsation, the simulated flow patterns
in a system of frictionless particles is entirely different from the ones observed with
frictional particles.
Figure 5.10 compares the appearance of macroscopic flow patterns during a pulse
period in T5 and D5-0. Both systems create recursive bubbling flows, and yet fail
the “fingerprint” test, as they do not capture the experimentally witnessed structures.
Interestingly, these periodic flows resemble each other qualitatively and both render a
preferable path for bubbles to travel. In every cycle, gas voids of small area emerge in
the regions adjacent to the walls, move rapidly to the centre region and grow as they
rise upwards. When approaching the surface, large bubbles move slightly towards
the sidewall and eventually break up. The agitation of solids phase is shown to be
more vigorous in D5-0 than T5, leading to a greater expansion of the emulsion phase
and larger bubbles that occupy almost two-third of the simulated domain.
Figure 5.11 compares the time-averaged bubbling probability maps for both T5
and D5-0. The map of T5 is greatly sharp and represents a more stable periodic flow.
The preferential pathway of bubbles can be clearly identified at the centre and both
corners. In contrast, D5-0 renders a less clear probability map, which demonstrates
the recursive flows of bubbles travel in a wider but less determined pathway. The rate
of noise increases with bed height, especially in the central region. In D5-0, bubbles
rise above y = 2.5 cm and grow into an irregular slug that spans almost entire crosssection. The emergence of such a massive slug strongly agitates the solids, and results
in high bubbling probability densities in the map.
The macroscopic circulation of bubbles naturally couples and drives corresponding movements of solids. Dragged by these rising bubbles, the particles are
Fig. 5.10 Evolution of simulated flow patterns in the pulsed bed of frictionless particles in a D5-0
(CFD-DEM) and b T5 (TFM). Snapshots are taken during a single period of the oscillating gas.
White areas stand for the bubble phase, whereas black areas represent for the emulsion phase