

5.5 Results and Discussion
127
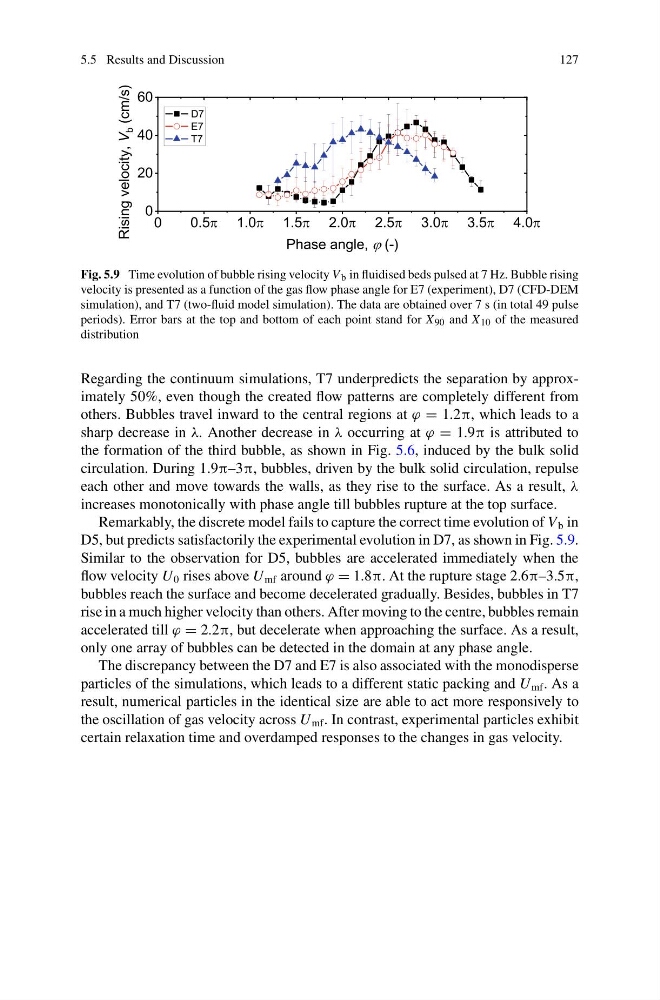
Fig. 5.9 Time evolution of bubble rising velocity V b in fluidised beds pulsed at 7 Hz. Bubble rising
velocity is presented as a function of the gas flow phase angle for E7 (experiment), D7 (CFD-DEM
simulation), and T7 (two-fluid model simulation). The data are obtained over 7 s (in total 49 pulse
periods). Error bars at the top and bottom of each point stand for X 90 and X 10 of the measured
distribution
Regarding the continuum simulations, T7 underpredicts the separation by approximately 50%, even though the created flow patterns are completely different from
others. Bubbles travel inward to the central regions at ϕ = 1.2π, which leads to a
sharp decrease in λ. Another decrease in λ occurring at ϕ = 1.9π is attributed to
the formation of the third bubble, as shown in Fig. 5.6, induced by the bulk solid
circulation. During 1.9π–3π, bubbles, driven by the bulk solid circulation, repulse
each other and move towards the walls, as they rise to the surface. As a result, λ
increases monotonically with phase angle till bubbles rupture at the top surface.
Remarkably, the discrete model fails to capture the correct time evolution of V b in
D5, but predicts satisfactorily the experimental evolution in D7, as shown in Fig. 5.9.
Similar to the observation for D5, bubbles are accelerated immediately when the
flow velocity U 0 rises above U mf around ϕ = 1.8π. At the rupture stage 2.6π–3.5π,
bubbles reach the surface and become decelerated gradually. Besides, bubbles in T7
rise in a much higher velocity than others. After moving to the centre, bubbles remain
accelerated till ϕ = 2.2π, but decelerate when approaching the surface. As a result,
only one array of bubbles can be detected in the domain at any phase angle.
The discrepancy between the D7 and E7 is also associated with the monodisperse
particles of the simulations, which leads to a different static packing and U mf . As a
result, numerical particles in the identical size are able to act more responsively to
the oscillation of gas velocity across U mf . In contrast, experimental particles exhibit
certain relaxation time and overdamped responses to the changes in gas velocity.
127
Fig. 5.9 Time evolution of bubble rising velocity V b in fluidised beds pulsed at 7 Hz. Bubble rising
velocity is presented as a function of the gas flow phase angle for E7 (experiment), D7 (CFD-DEM
simulation), and T7 (two-fluid model simulation). The data are obtained over 7 s (in total 49 pulse
periods). Error bars at the top and bottom of each point stand for X 90 and X 10 of the measured
distribution
Regarding the continuum simulations, T7 underpredicts the separation by approximately 50%, even though the created flow patterns are completely different from
others. Bubbles travel inward to the central regions at ϕ = 1.2π, which leads to a
sharp decrease in λ. Another decrease in λ occurring at ϕ = 1.9π is attributed to
the formation of the third bubble, as shown in Fig. 5.6, induced by the bulk solid
circulation. During 1.9π–3π, bubbles, driven by the bulk solid circulation, repulse
each other and move towards the walls, as they rise to the surface. As a result, λ
increases monotonically with phase angle till bubbles rupture at the top surface.
Remarkably, the discrete model fails to capture the correct time evolution of V b in
D5, but predicts satisfactorily the experimental evolution in D7, as shown in Fig. 5.9.
Similar to the observation for D5, bubbles are accelerated immediately when the
flow velocity U 0 rises above U mf around ϕ = 1.8π. At the rupture stage 2.6π–3.5π,
bubbles reach the surface and become decelerated gradually. Besides, bubbles in T7
rise in a much higher velocity than others. After moving to the centre, bubbles remain
accelerated till ϕ = 2.2π, but decelerate when approaching the surface. As a result,
only one array of bubbles can be detected in the domain at any phase angle.
The discrepancy between the D7 and E7 is also associated with the monodisperse
particles of the simulations, which leads to a different static packing and U mf . As a
result, numerical particles in the identical size are able to act more responsively to
the oscillation of gas velocity across U mf . In contrast, experimental particles exhibit
certain relaxation time and overdamped responses to the changes in gas velocity.