

126
5 The Role of Solid Mechanics in Stabilising Structured Flows
0
0.5
1.0
1.5
2.0
2.5
3.0
3.5
4.0
0
1
2
3
Bubble size,
D
b (cm)
Phase angle, (-)
D7
E7
T7
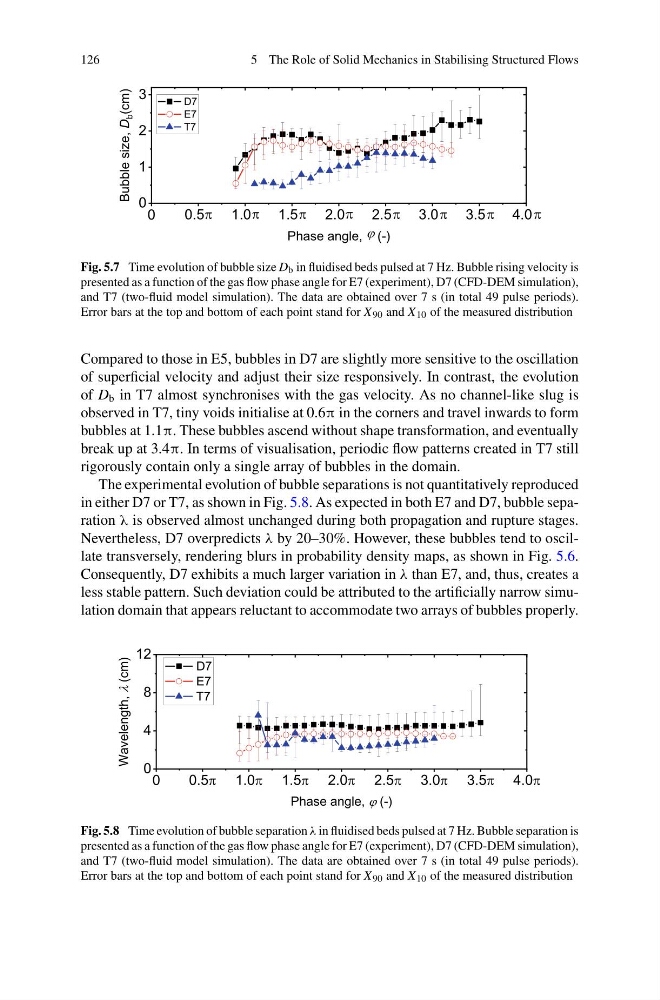
Fig. 5.7 Time evolution of bubble size D b in fluidised beds pulsed at 7 Hz. Bubble rising velocity is
presented as a function of the gas flow phase angle for E7 (experiment), D7 (CFD-DEM simulation),
and T7 (two-fluid model simulation). The data are obtained over 7 s (in total 49 pulse periods).
Error bars at the top and bottom of each point stand for X 90 and X 10 of the measured distribution
Compared to those in E5, bubbles in D7 are slightly more sensitive to the oscillation
of superficial velocity and adjust their size responsively. In contrast, the evolution
of D b in T7 almost synchronises with the gas velocity. As no channel-like slug is
observed in T7, tiny voids initialise at 0.6π in the corners and travel inwards to form
bubbles at 1.1π. These bubbles ascend without shape transformation, and eventually
break up at 3.4π. In terms of visualisation, periodic flow patterns created in T7 still
rigorously contain only a single array of bubbles in the domain.
The experimental evolution of bubble separations is not quantitatively reproduced
in either D7 or T7, as shown in Fig. 5.8. As expected in both E7 and D7, bubble separation λ is observed almost unchanged during both propagation and rupture stages.
Nevertheless, D7 overpredicts λ by 20–30%. However, these bubbles tend to oscillate transversely, rendering blurs in probability density maps, as shown in Fig. 5.6.
Consequently, D7 exhibits a much larger variation in λ than E7, and, thus, creates a
less stable pattern. Such deviation could be attributed to the artificially narrow simulation domain that appears reluctant to accommodate two arrays of bubbles properly.
Fig. 5.8 Time evolution of bubble separation λ in fluidised beds pulsed at 7 Hz. Bubble separation is
presented as a function of the gas flow phase angle for E7 (experiment), D7 (CFD-DEM simulation),
and T7 (two-fluid model simulation). The data are obtained over 7 s (in total 49 pulse periods).
Error bars at the top and bottom of each point stand for X 90 and X 10 of the measured distribution
5 The Role of Solid Mechanics in Stabilising Structured Flows
0
0.5
1.0
1.5
2.0
2.5
3.0
3.5
4.0
0
1
2
3
Bubble size,
D
b (cm)
Phase angle, (-)
D7
E7
T7
Fig. 5.7 Time evolution of bubble size D b in fluidised beds pulsed at 7 Hz. Bubble rising velocity is
presented as a function of the gas flow phase angle for E7 (experiment), D7 (CFD-DEM simulation),
and T7 (two-fluid model simulation). The data are obtained over 7 s (in total 49 pulse periods).
Error bars at the top and bottom of each point stand for X 90 and X 10 of the measured distribution
Compared to those in E5, bubbles in D7 are slightly more sensitive to the oscillation
of superficial velocity and adjust their size responsively. In contrast, the evolution
of D b in T7 almost synchronises with the gas velocity. As no channel-like slug is
observed in T7, tiny voids initialise at 0.6π in the corners and travel inwards to form
bubbles at 1.1π. These bubbles ascend without shape transformation, and eventually
break up at 3.4π. In terms of visualisation, periodic flow patterns created in T7 still
rigorously contain only a single array of bubbles in the domain.
The experimental evolution of bubble separations is not quantitatively reproduced
in either D7 or T7, as shown in Fig. 5.8. As expected in both E7 and D7, bubble separation λ is observed almost unchanged during both propagation and rupture stages.
Nevertheless, D7 overpredicts λ by 20–30%. However, these bubbles tend to oscillate transversely, rendering blurs in probability density maps, as shown in Fig. 5.6.
Consequently, D7 exhibits a much larger variation in λ than E7, and, thus, creates a
less stable pattern. Such deviation could be attributed to the artificially narrow simulation domain that appears reluctant to accommodate two arrays of bubbles properly.
Fig. 5.8 Time evolution of bubble separation λ in fluidised beds pulsed at 7 Hz. Bubble separation is
presented as a function of the gas flow phase angle for E7 (experiment), D7 (CFD-DEM simulation),
and T7 (two-fluid model simulation). The data are obtained over 7 s (in total 49 pulse periods).
Error bars at the top and bottom of each point stand for X 90 and X 10 of the measured distribution