

5.5 Results and Discussion
125
5.5.3 Evolution of Double-Array Bubble Patterns
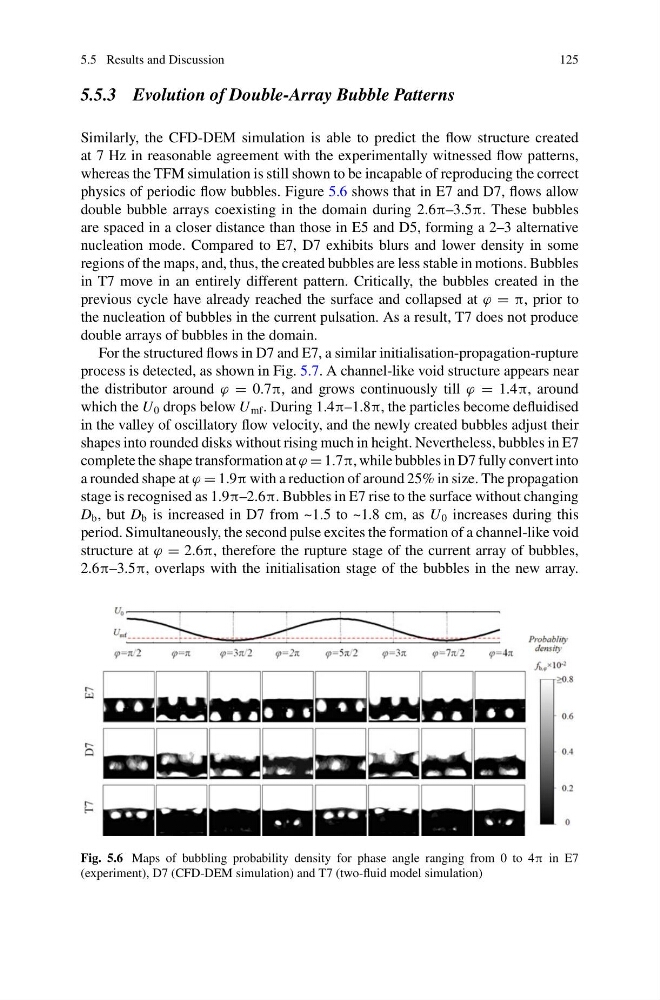
Similarly, the CFD-DEM simulation is able to predict the flow structure created
at 7 Hz in reasonable agreement with the experimentally witnessed flow patterns,
whereas the TFM simulation is still shown to be incapable of reproducing the correct
physics of periodic flow bubbles. Figure 5.6 shows that in E7 and D7, flows allow
double bubble arrays coexisting in the domain during 2.6π–3.5π. These bubbles
are spaced in a closer distance than those in E5 and D5, forming a 2–3 alternative
nucleation mode. Compared to E7, D7 exhibits blurs and lower density in some
regions of the maps, and, thus, the created bubbles are less stable in motions. Bubbles
in T7 move in an entirely different pattern. Critically, the bubbles created in the
previous cycle have already reached the surface and collapsed at ϕ = π, prior to
the nucleation of bubbles in the current pulsation. As a result, T7 does not produce
double arrays of bubbles in the domain.
For the structured flows in D7 and E7, a similar initialisation-propagation-rupture
process is detected, as shown in Fig. 5.7. A channel-like void structure appears near
the distributor around ϕ = 0.7π, and grows continuously till ϕ = 1.4π, around
which the U 0 drops below U mf . During 1.4π–1.8π, the particles become defluidised
in the valley of oscillatory flow velocity, and the newly created bubbles adjust their
shapes into rounded disks without rising much in height. Nevertheless, bubbles in E7
complete the shape transformation at ϕ = 1.7π, while bubbles in D7 fully convert into
a rounded shape at ϕ = 1.9π with a reduction of around 25% in size. The propagation
stage is recognised as 1.9π–2.6π. Bubbles in E7 rise to the surface without changing
D b , but D b is increased in D7 from ~1.5 to ~1.8 cm, as U 0 increases during this
period. Simultaneously, the second pulse excites the formation of a channel-like void
structure at ϕ = 2.6π, therefore the rupture stage of the current array of bubbles,
2.6π–3.5π, overlaps with the initialisation stage of the bubbles in the new array.
Fig. 5.6 Maps of bubbling probability density for phase angle ranging from 0 to 4π in E7
(experiment), D7 (CFD-DEM simulation) and T7 (two-fluid model simulation)
125
5.5.3 Evolution of Double-Array Bubble Patterns
Similarly, the CFD-DEM simulation is able to predict the flow structure created
at 7 Hz in reasonable agreement with the experimentally witnessed flow patterns,
whereas the TFM simulation is still shown to be incapable of reproducing the correct
physics of periodic flow bubbles. Figure 5.6 shows that in E7 and D7, flows allow
double bubble arrays coexisting in the domain during 2.6π–3.5π. These bubbles
are spaced in a closer distance than those in E5 and D5, forming a 2–3 alternative
nucleation mode. Compared to E7, D7 exhibits blurs and lower density in some
regions of the maps, and, thus, the created bubbles are less stable in motions. Bubbles
in T7 move in an entirely different pattern. Critically, the bubbles created in the
previous cycle have already reached the surface and collapsed at ϕ = π, prior to
the nucleation of bubbles in the current pulsation. As a result, T7 does not produce
double arrays of bubbles in the domain.
For the structured flows in D7 and E7, a similar initialisation-propagation-rupture
process is detected, as shown in Fig. 5.7. A channel-like void structure appears near
the distributor around ϕ = 0.7π, and grows continuously till ϕ = 1.4π, around
which the U 0 drops below U mf . During 1.4π–1.8π, the particles become defluidised
in the valley of oscillatory flow velocity, and the newly created bubbles adjust their
shapes into rounded disks without rising much in height. Nevertheless, bubbles in E7
complete the shape transformation at ϕ = 1.7π, while bubbles in D7 fully convert into
a rounded shape at ϕ = 1.9π with a reduction of around 25% in size. The propagation
stage is recognised as 1.9π–2.6π. Bubbles in E7 rise to the surface without changing
D b , but D b is increased in D7 from ~1.5 to ~1.8 cm, as U 0 increases during this
period. Simultaneously, the second pulse excites the formation of a channel-like void
structure at ϕ = 2.6π, therefore the rupture stage of the current array of bubbles,
2.6π–3.5π, overlaps with the initialisation stage of the bubbles in the new array.
Fig. 5.6 Maps of bubbling probability density for phase angle ranging from 0 to 4π in E7
(experiment), D7 (CFD-DEM simulation) and T7 (two-fluid model simulation)