

124
5 The Role of Solid Mechanics in Stabilising Structured Flows
in quantitative agreement with the experimental measurements during 1.1π–2.0π.
Besides, the variation in λ is kept less than 5%, showing that the created structure is
highly reproducible and predictable. In the prorogation stage, bubbles develop from
a horizontally elongated shape to a rounded shape in E5, but an axially elongated
shape in D5. Therefore, the geometry centres of two bubbles move away from each
other and a slight increase in λ is observed during 1.3π–1.5π. On the other hand, in
T5, λ sharply decreases from around 7.5 to 3.0 cm at ϕ = 1.1π. Such a decrease is
attributed to the inward motion of bubbles from both sidewalls, and leads to changes
in the growth rate of D b as well. In addition, λ varies largely in T5, up to 50% for
several phase angles, which shows the created flow is unstable.
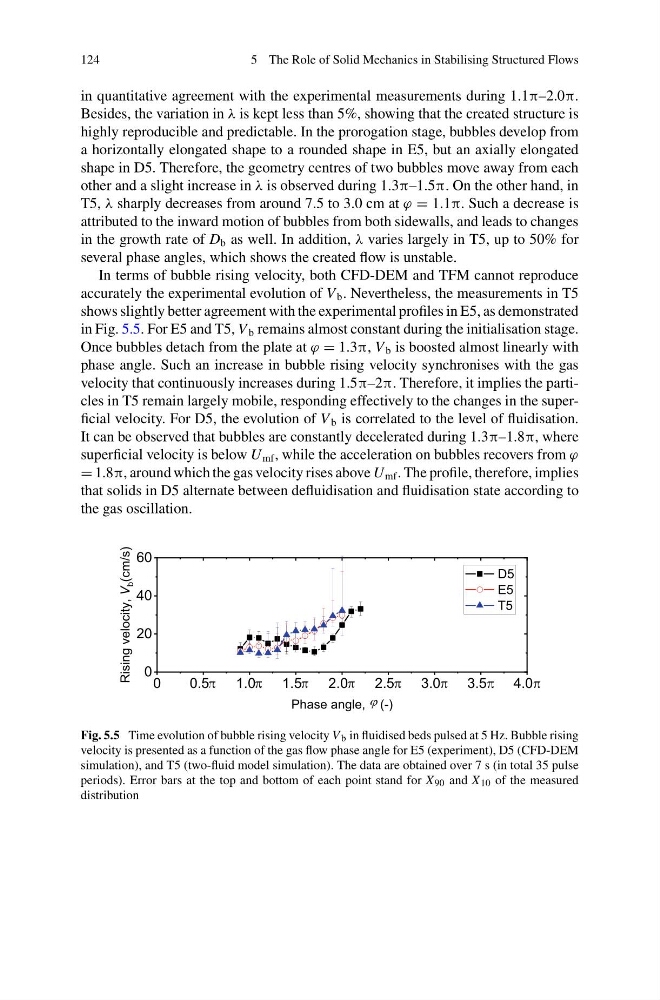
In terms of bubble rising velocity, both CFD-DEM and TFM cannot reproduce
accurately the experimental evolution of V b . Nevertheless, the measurements in T5
shows slightly better agreement with the experimental profiles in E5, as demonstrated
in Fig. 5.5. For E5 and T5, V b remains almost constant during the initialisation stage.
Once bubbles detach from the plate at ϕ = 1.3π, V b is boosted almost linearly with
phase angle. Such an increase in bubble rising velocity synchronises with the gas
velocity that continuously increases during 1.5π–2π. Therefore, it implies the particles in T5 remain largely mobile, responding effectively to the changes in the superficial velocity. For D5, the evolution of V b is correlated to the level of fluidisation.
It can be observed that bubbles are constantly decelerated during 1.3π–1.8π, where
superficial velocity is below U mf , while the acceleration on bubbles recovers from ϕ
= 1.8π, around which the gas velocity rises above U mf . The profile, therefore, implies
that solids in D5 alternate between defluidisation and fluidisation state according to
the gas oscillation.
0
0.5
1.0
1.5
2.0
2.5
3.0
3.5
4.0
0
20
40
60
Rising velocity,
V
b (cm/s)
Phase angle, (-)
D5
E5
T5
Fig. 5.5 Time evolution of bubble rising velocity V b in fluidised beds pulsed at 5 Hz. Bubble rising
velocity is presented as a function of the gas flow phase angle for E5 (experiment), D5 (CFD-DEM
simulation), and T5 (two-fluid model simulation). The data are obtained over 7 s (in total 35 pulse
periods). Error bars at the top and bottom of each point stand for X 90 and X 10 of the measured
distribution
5 The Role of Solid Mechanics in Stabilising Structured Flows
in quantitative agreement with the experimental measurements during 1.1π–2.0π.
Besides, the variation in λ is kept less than 5%, showing that the created structure is
highly reproducible and predictable. In the prorogation stage, bubbles develop from
a horizontally elongated shape to a rounded shape in E5, but an axially elongated
shape in D5. Therefore, the geometry centres of two bubbles move away from each
other and a slight increase in λ is observed during 1.3π–1.5π. On the other hand, in
T5, λ sharply decreases from around 7.5 to 3.0 cm at ϕ = 1.1π. Such a decrease is
attributed to the inward motion of bubbles from both sidewalls, and leads to changes
in the growth rate of D b as well. In addition, λ varies largely in T5, up to 50% for
several phase angles, which shows the created flow is unstable.
In terms of bubble rising velocity, both CFD-DEM and TFM cannot reproduce
accurately the experimental evolution of V b . Nevertheless, the measurements in T5
shows slightly better agreement with the experimental profiles in E5, as demonstrated
in Fig. 5.5. For E5 and T5, V b remains almost constant during the initialisation stage.
Once bubbles detach from the plate at ϕ = 1.3π, V b is boosted almost linearly with
phase angle. Such an increase in bubble rising velocity synchronises with the gas
velocity that continuously increases during 1.5π–2π. Therefore, it implies the particles in T5 remain largely mobile, responding effectively to the changes in the superficial velocity. For D5, the evolution of V b is correlated to the level of fluidisation.
It can be observed that bubbles are constantly decelerated during 1.3π–1.8π, where
superficial velocity is below U mf , while the acceleration on bubbles recovers from ϕ
= 1.8π, around which the gas velocity rises above U mf . The profile, therefore, implies
that solids in D5 alternate between defluidisation and fluidisation state according to
the gas oscillation.
0
0.5
1.0
1.5
2.0
2.5
3.0
3.5
4.0
0
20
40
60
Rising velocity,
V
b (cm/s)
Phase angle, (-)
D5
E5
T5
Fig. 5.5 Time evolution of bubble rising velocity V b in fluidised beds pulsed at 5 Hz. Bubble rising
velocity is presented as a function of the gas flow phase angle for E5 (experiment), D5 (CFD-DEM
simulation), and T5 (two-fluid model simulation). The data are obtained over 7 s (in total 35 pulse
periods). Error bars at the top and bottom of each point stand for X 90 and X 10 of the measured
distribution