

5.5 Results and Discussion
123
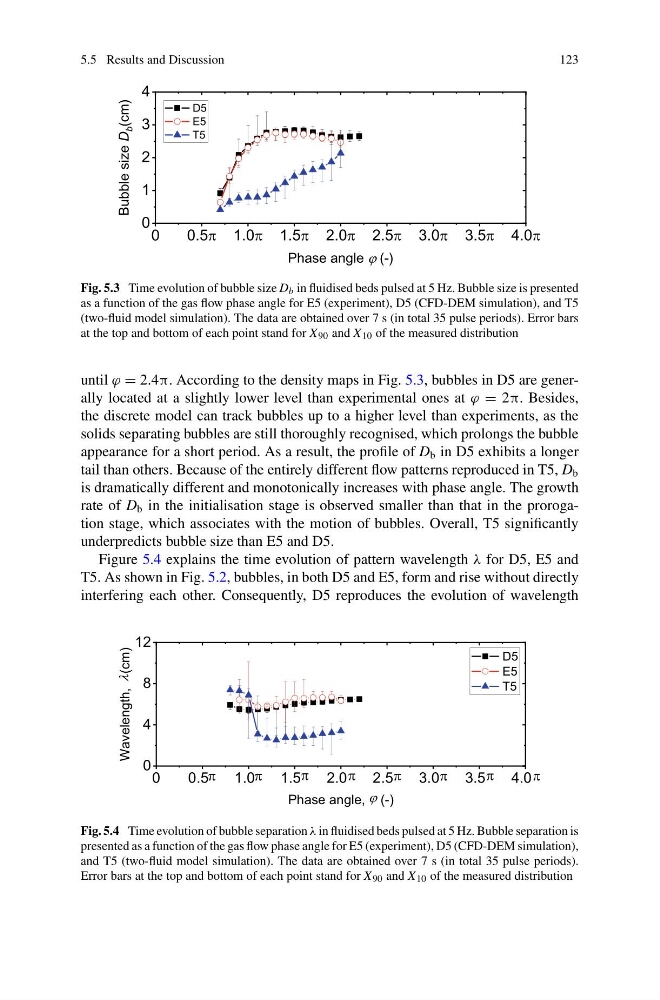
Fig. 5.3 Time evolution of bubble size D b in fluidised beds pulsed at 5 Hz. Bubble size is presented
as a function of the gas flow phase angle for E5 (experiment), D5 (CFD-DEM simulation), and T5
(two-fluid model simulation). The data are obtained over 7 s (in total 35 pulse periods). Error bars
at the top and bottom of each point stand for X 90 and X 10 of the measured distribution
until ϕ = 2.4π. According to the density maps in Fig. 5.3, bubbles in D5 are generally located at a slightly lower level than experimental ones at ϕ = 2π. Besides,
the discrete model can track bubbles up to a higher level than experiments, as the
solids separating bubbles are still thoroughly recognised, which prolongs the bubble
appearance for a short period. As a result, the profile of D b in D5 exhibits a longer
tail than others. Because of the entirely different flow patterns reproduced in T5, D b
is dramatically different and monotonically increases with phase angle. The growth
rate of D b in the initialisation stage is observed smaller than that in the prorogation stage, which associates with the motion of bubbles. Overall, T5 significantly
underpredicts bubble size than E5 and D5.
Figure 5.4 explains the time evolution of pattern wavelength λ for D5, E5 and
T5. As shown in Fig. 5.2, bubbles, in both D5 and E5, form and rise without directly
interfering each other. Consequently, D5 reproduces the evolution of wavelength
0
0.5
1.0
1.5
2.0
2.5
3.0
3.5
4.0
0
4
8
12
Wavelength,
(cm)
Phase angle, (-)
D5
E5
T5
Fig. 5.4 Time evolution of bubble separation λ in fluidised beds pulsed at 5 Hz. Bubble separation is
presented as a function of the gas flow phase angle for E5 (experiment), D5 (CFD-DEM simulation),
and T5 (two-fluid model simulation). The data are obtained over 7 s (in total 35 pulse periods).
Error bars at the top and bottom of each point stand for X 90 and X 10 of the measured distribution
123
Fig. 5.3 Time evolution of bubble size D b in fluidised beds pulsed at 5 Hz. Bubble size is presented
as a function of the gas flow phase angle for E5 (experiment), D5 (CFD-DEM simulation), and T5
(two-fluid model simulation). The data are obtained over 7 s (in total 35 pulse periods). Error bars
at the top and bottom of each point stand for X 90 and X 10 of the measured distribution
until ϕ = 2.4π. According to the density maps in Fig. 5.3, bubbles in D5 are generally located at a slightly lower level than experimental ones at ϕ = 2π. Besides,
the discrete model can track bubbles up to a higher level than experiments, as the
solids separating bubbles are still thoroughly recognised, which prolongs the bubble
appearance for a short period. As a result, the profile of D b in D5 exhibits a longer
tail than others. Because of the entirely different flow patterns reproduced in T5, D b
is dramatically different and monotonically increases with phase angle. The growth
rate of D b in the initialisation stage is observed smaller than that in the prorogation stage, which associates with the motion of bubbles. Overall, T5 significantly
underpredicts bubble size than E5 and D5.
Figure 5.4 explains the time evolution of pattern wavelength λ for D5, E5 and
T5. As shown in Fig. 5.2, bubbles, in both D5 and E5, form and rise without directly
interfering each other. Consequently, D5 reproduces the evolution of wavelength
0
0.5
1.0
1.5
2.0
2.5
3.0
3.5
4.0
0
4
8
12
Wavelength,
(cm)
Phase angle, (-)
D5
E5
T5
Fig. 5.4 Time evolution of bubble separation λ in fluidised beds pulsed at 5 Hz. Bubble separation is
presented as a function of the gas flow phase angle for E5 (experiment), D5 (CFD-DEM simulation),
and T5 (two-fluid model simulation). The data are obtained over 7 s (in total 35 pulse periods).
Error bars at the top and bottom of each point stand for X 90 and X 10 of the measured distribution