

122
5 The Role of Solid Mechanics in Stabilising Structured Flows
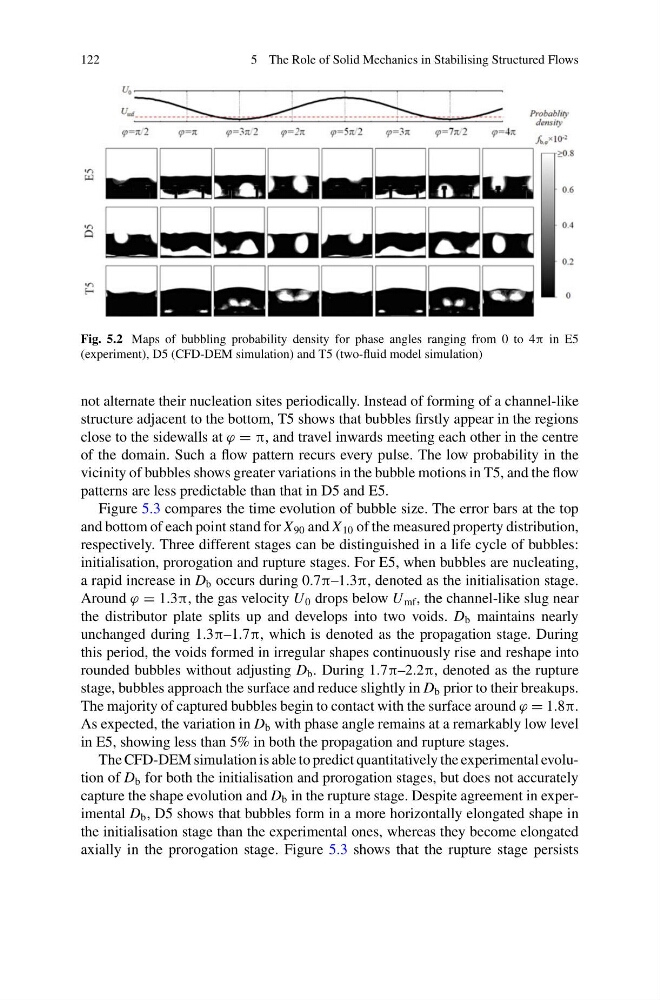
Fig. 5.2 Maps of bubbling probability density for phase angles ranging from 0 to 4π in E5
(experiment), D5 (CFD-DEM simulation) and T5 (two-fluid model simulation)
not alternate their nucleation sites periodically. Instead of forming of a channel-like
structure adjacent to the bottom, T5 shows that bubbles firstly appear in the regions
close to the sidewalls at ϕ = π, and travel inwards meeting each other in the centre
of the domain. Such a flow pattern recurs every pulse. The low probability in the
vicinity of bubbles shows greater variations in the bubble motions in T5, and the flow
patterns are less predictable than that in D5 and E5.
Figure 5.3 compares the time evolution of bubble size. The error bars at the top
and bottom of each point stand for X 90 and X 10 of the measured property distribution,
respectively. Three different stages can be distinguished in a life cycle of bubbles:
initialisation, prorogation and rupture stages. For E5, when bubbles are nucleating,
a rapid increase in D b occurs during 0.7π–1.3π, denoted as the initialisation stage.
Around ϕ = 1.3π, the gas velocity U 0 drops below U mf , the channel-like slug near
the distributor plate splits up and develops into two voids. D b maintains nearly
unchanged during 1.3π–1.7π, which is denoted as the propagation stage. During
this period, the voids formed in irregular shapes continuously rise and reshape into
rounded bubbles without adjusting D b . During 1.7π–2.2π, denoted as the rupture
stage, bubbles approach the surface and reduce slightly in D b prior to their breakups.
The majority of captured bubbles begin to contact with the surface around ϕ = 1.8π.
As expected, the variation in D b with phase angle remains at a remarkably low level
in E5, showing less than 5% in both the propagation and rupture stages.
The CFD-DEM simulation is able to predict quantitatively the experimental evolution of D b for both the initialisation and prorogation stages, but does not accurately
capture the shape evolution and D b in the rupture stage. Despite agreement in experimental D b , D5 shows that bubbles form in a more horizontally elongated shape in
the initialisation stage than the experimental ones, whereas they become elongated
axially in the prorogation stage. Figure 5.3 shows that the rupture stage persists
5 The Role of Solid Mechanics in Stabilising Structured Flows
Fig. 5.2 Maps of bubbling probability density for phase angles ranging from 0 to 4π in E5
(experiment), D5 (CFD-DEM simulation) and T5 (two-fluid model simulation)
not alternate their nucleation sites periodically. Instead of forming of a channel-like
structure adjacent to the bottom, T5 shows that bubbles firstly appear in the regions
close to the sidewalls at ϕ = π, and travel inwards meeting each other in the centre
of the domain. Such a flow pattern recurs every pulse. The low probability in the
vicinity of bubbles shows greater variations in the bubble motions in T5, and the flow
patterns are less predictable than that in D5 and E5.
Figure 5.3 compares the time evolution of bubble size. The error bars at the top
and bottom of each point stand for X 90 and X 10 of the measured property distribution,
respectively. Three different stages can be distinguished in a life cycle of bubbles:
initialisation, prorogation and rupture stages. For E5, when bubbles are nucleating,
a rapid increase in D b occurs during 0.7π–1.3π, denoted as the initialisation stage.
Around ϕ = 1.3π, the gas velocity U 0 drops below U mf , the channel-like slug near
the distributor plate splits up and develops into two voids. D b maintains nearly
unchanged during 1.3π–1.7π, which is denoted as the propagation stage. During
this period, the voids formed in irregular shapes continuously rise and reshape into
rounded bubbles without adjusting D b . During 1.7π–2.2π, denoted as the rupture
stage, bubbles approach the surface and reduce slightly in D b prior to their breakups.
The majority of captured bubbles begin to contact with the surface around ϕ = 1.8π.
As expected, the variation in D b with phase angle remains at a remarkably low level
in E5, showing less than 5% in both the propagation and rupture stages.
The CFD-DEM simulation is able to predict quantitatively the experimental evolution of D b for both the initialisation and prorogation stages, but does not accurately
capture the shape evolution and D b in the rupture stage. Despite agreement in experimental D b , D5 shows that bubbles form in a more horizontally elongated shape in
the initialisation stage than the experimental ones, whereas they become elongated
axially in the prorogation stage. Figure 5.3 shows that the rupture stage persists