

5.5 Results and Discussion
121
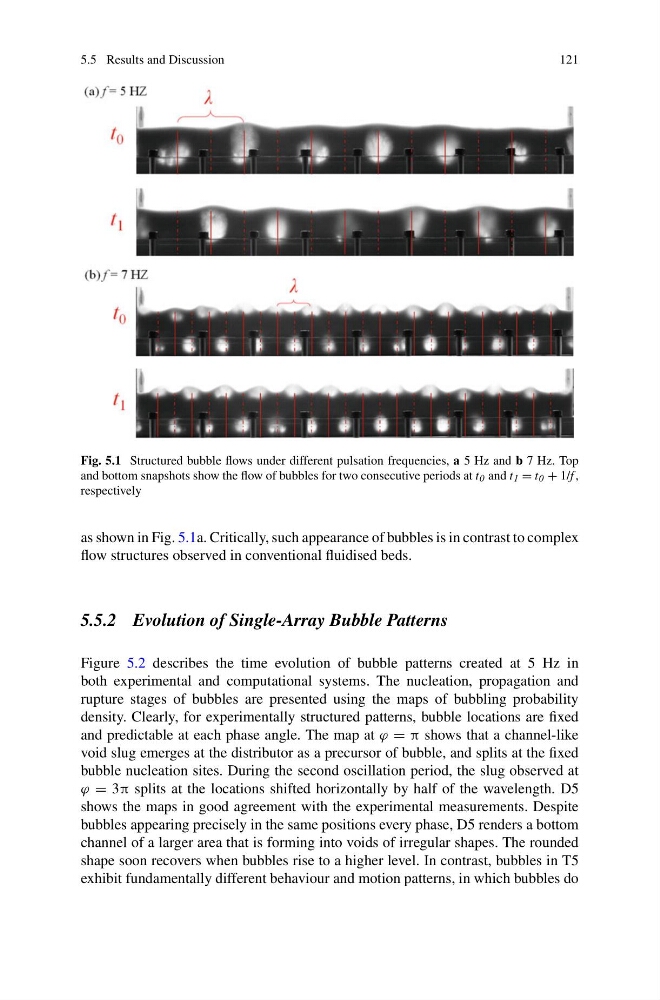
Fig. 5.1 Structured bubble flows under different pulsation frequencies, a 5 Hz and b 7 Hz. Top
and bottom snapshots show the flow of bubbles for two consecutive periods at t 0 and t 1 = t 0 + 1/f ,
respectively
as shown in Fig. 5.1a. Critically, such appearance of bubbles is in contrast to complex
flow structures observed in conventional fluidised beds.
5.5.2 Evolution of Single-Array Bubble Patterns
Figure 5.2 describes the time evolution of bubble patterns created at 5 Hz in
both experimental and computational systems. The nucleation, propagation and
rupture stages of bubbles are presented using the maps of bubbling probability
density. Clearly, for experimentally structured patterns, bubble locations are fixed
and predictable at each phase angle. The map at ϕ = π shows that a channel-like
void slug emerges at the distributor as a precursor of bubble, and splits at the fixed
bubble nucleation sites. During the second oscillation period, the slug observed at
ϕ = 3π splits at the locations shifted horizontally by half of the wavelength. D5
shows the maps in good agreement with the experimental measurements. Despite
bubbles appearing precisely in the same positions every phase, D5 renders a bottom
channel of a larger area that is forming into voids of irregular shapes. The rounded
shape soon recovers when bubbles rise to a higher level. In contrast, bubbles in T5
exhibit fundamentally different behaviour and motion patterns, in which bubbles do
121
Fig. 5.1 Structured bubble flows under different pulsation frequencies, a 5 Hz and b 7 Hz. Top
and bottom snapshots show the flow of bubbles for two consecutive periods at t 0 and t 1 = t 0 + 1/f ,
respectively
as shown in Fig. 5.1a. Critically, such appearance of bubbles is in contrast to complex
flow structures observed in conventional fluidised beds.
5.5.2 Evolution of Single-Array Bubble Patterns
Figure 5.2 describes the time evolution of bubble patterns created at 5 Hz in
both experimental and computational systems. The nucleation, propagation and
rupture stages of bubbles are presented using the maps of bubbling probability
density. Clearly, for experimentally structured patterns, bubble locations are fixed
and predictable at each phase angle. The map at ϕ = π shows that a channel-like
void slug emerges at the distributor as a precursor of bubble, and splits at the fixed
bubble nucleation sites. During the second oscillation period, the slug observed at
ϕ = 3π splits at the locations shifted horizontally by half of the wavelength. D5
shows the maps in good agreement with the experimental measurements. Despite
bubbles appearing precisely in the same positions every phase, D5 renders a bottom
channel of a larger area that is forming into voids of irregular shapes. The rounded
shape soon recovers when bubbles rise to a higher level. In contrast, bubbles in T5
exhibit fundamentally different behaviour and motion patterns, in which bubbles do