

120
5 The Role of Solid Mechanics in Stabilising Structured Flows
5.5 Results and Discussion
Experiments and simulations are carried out with spherical particles at two different
frequencies of 5 and 7 Hz. For simulations, different degree of interparticle friction is
implemented via either varying solid friction coefficient μ f in the CFD-DEM simulations, or frictional packing limit φ f in the TFM simulations. To evaluate the hydrodynamics in both systems, size, separation and rising velocity of bubbles, solid circulation and solid pressure are compared once the system reaches a steady fluidisation
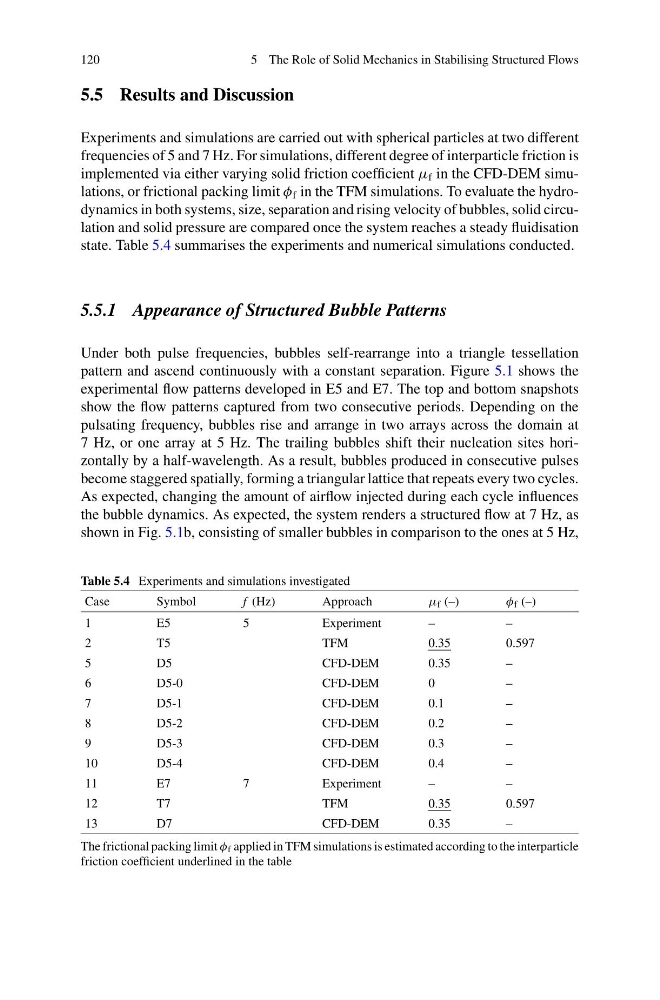
state. Table 5.4 summarises the experiments and numerical simulations conducted.
5.5.1 Appearance of Structured Bubble Patterns
Under both pulse frequencies, bubbles self-rearrange into a triangle tessellation
pattern and ascend continuously with a constant separation. Figure 5.1 shows the
experimental flow patterns developed in E5 and E7. The top and bottom snapshots
show the flow patterns captured from two consecutive periods. Depending on the
pulsating frequency, bubbles rise and arrange in two arrays across the domain at
7 Hz, or one array at 5 Hz. The trailing bubbles shift their nucleation sites horizontally by a half-wavelength. As a result, bubbles produced in consecutive pulses
become staggered spatially, forming a triangular lattice that repeats every two cycles.
As expected, changing the amount of airflow injected during each cycle influences
the bubble dynamics. As expected, the system renders a structured flow at 7 Hz, as
shown in Fig. 5.1b, consisting of smaller bubbles in comparison to the ones at 5 Hz,
Table 5.4 Experiments and simulations investigated
Case
Symbol
f (Hz)
Approach
μ f (–)
φ f (–)
1
E5
5
Experiment
–
–
2
T 5
T F M
0.35
0.597
5
D5
CFD-DEM
0.35
–
6
D 5 - 0
C F D - D E M
0
–
7
D5-1
CFD-DEM
0.1
–
8
D5-2
CFD-DEM
0.2
–
9
D5-3
CFD-DEM
0.3
–
10
D5-4
CFD-DEM
0.4
–
11
E7
7
Experiment
–
–
12
T7
TFM
0.35
0.597
13
D7
CFD-DEM
0.35
–
The frictional packing limit φ f applied in TFM simulations is estimated according to the interparticle
friction coefficient underlined in the table
5 The Role of Solid Mechanics in Stabilising Structured Flows
5.5 Results and Discussion
Experiments and simulations are carried out with spherical particles at two different
frequencies of 5 and 7 Hz. For simulations, different degree of interparticle friction is
implemented via either varying solid friction coefficient μ f in the CFD-DEM simulations, or frictional packing limit φ f in the TFM simulations. To evaluate the hydrodynamics in both systems, size, separation and rising velocity of bubbles, solid circulation and solid pressure are compared once the system reaches a steady fluidisation
state. Table 5.4 summarises the experiments and numerical simulations conducted.
5.5.1 Appearance of Structured Bubble Patterns
Under both pulse frequencies, bubbles self-rearrange into a triangle tessellation
pattern and ascend continuously with a constant separation. Figure 5.1 shows the
experimental flow patterns developed in E5 and E7. The top and bottom snapshots
show the flow patterns captured from two consecutive periods. Depending on the
pulsating frequency, bubbles rise and arrange in two arrays across the domain at
7 Hz, or one array at 5 Hz. The trailing bubbles shift their nucleation sites horizontally by a half-wavelength. As a result, bubbles produced in consecutive pulses
become staggered spatially, forming a triangular lattice that repeats every two cycles.
As expected, changing the amount of airflow injected during each cycle influences
the bubble dynamics. As expected, the system renders a structured flow at 7 Hz, as
shown in Fig. 5.1b, consisting of smaller bubbles in comparison to the ones at 5 Hz,
Table 5.4 Experiments and simulations investigated
Case
Symbol
f (Hz)
Approach
μ f (–)
φ f (–)
1
E5
5
Experiment
–
–
2
T 5
T F M
0.35
0.597
5
D5
CFD-DEM
0.35
–
6
D 5 - 0
C F D - D E M
0
–
7
D5-1
CFD-DEM
0.1
–
8
D5-2
CFD-DEM
0.2
–
9
D5-3
CFD-DEM
0.3
–
10
D5-4
CFD-DEM
0.4
–
11
E7
7
Experiment
–
–
12
T7
TFM
0.35
0.597
13
D7
CFD-DEM
0.35
–
The frictional packing limit φ f applied in TFM simulations is estimated according to the interparticle
friction coefficient underlined in the table