

108
4 Modelling Dynamically Structured Fluidisation
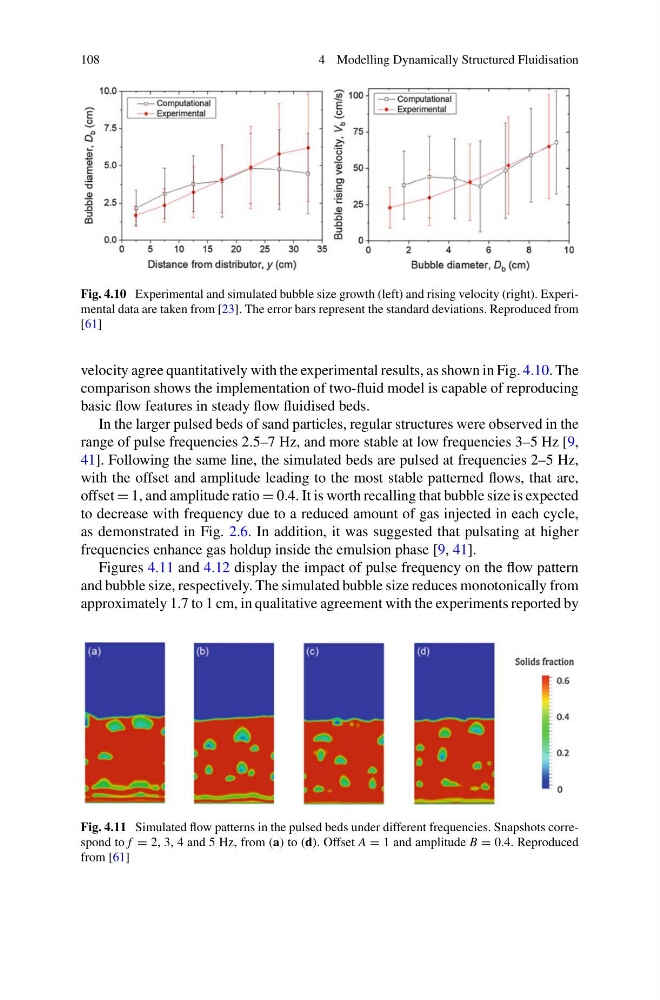
Fig. 4.10 Experimental and simulated bubble size growth (left) and rising velocity (right). Experimental data are taken from [23]. The error bars represent the standard deviations. Reproduced from
[61]
velocity agree quantitatively with the experimental results, as shown in Fig. 4.10. The
comparison shows the implementation of two-fluid model is capable of reproducing
basic flow features in steady flow fluidised beds.
In the larger pulsed beds of sand particles, regular structures were observed in the
range of pulse frequencies 2.5–7 Hz, and more stable at low frequencies 3–5 Hz [9,
41]. Following the same line, the simulated beds are pulsed at frequencies 2–5 Hz,
with the offset and amplitude leading to the most stable patterned flows, that are,
offset = 1, and amplitude ratio = 0.4. It is worth recalling that bubble size is expected
to decrease with frequency due to a reduced amount of gas injected in each cycle,
as demonstrated in Fig. 2.6. In addition, it was suggested that pulsating at higher
frequencies enhance gas holdup inside the emulsion phase [9, 41].
Figures 4.11 and 4.12 display the impact of pulse frequency on the flow pattern
and bubble size, respectively. The simulated bubble size reduces monotonically from
approximately 1.7 to 1 cm, in qualitative agreement with the experiments reported by
Fig. 4.11 Simulated flow patterns in the pulsed beds under different frequencies. Snapshots correspond to f = 2, 3, 4 and 5 Hz, from (a) to (d). Offset A = 1 and amplitude B = 0.4. Reproduced
from [61]
4 Modelling Dynamically Structured Fluidisation
Fig. 4.10 Experimental and simulated bubble size growth (left) and rising velocity (right). Experimental data are taken from [23]. The error bars represent the standard deviations. Reproduced from
[61]
velocity agree quantitatively with the experimental results, as shown in Fig. 4.10. The
comparison shows the implementation of two-fluid model is capable of reproducing
basic flow features in steady flow fluidised beds.
In the larger pulsed beds of sand particles, regular structures were observed in the
range of pulse frequencies 2.5–7 Hz, and more stable at low frequencies 3–5 Hz [9,
41]. Following the same line, the simulated beds are pulsed at frequencies 2–5 Hz,
with the offset and amplitude leading to the most stable patterned flows, that are,
offset = 1, and amplitude ratio = 0.4. It is worth recalling that bubble size is expected
to decrease with frequency due to a reduced amount of gas injected in each cycle,
as demonstrated in Fig. 2.6. In addition, it was suggested that pulsating at higher
frequencies enhance gas holdup inside the emulsion phase [9, 41].
Figures 4.11 and 4.12 display the impact of pulse frequency on the flow pattern
and bubble size, respectively. The simulated bubble size reduces monotonically from
approximately 1.7 to 1 cm, in qualitative agreement with the experiments reported by
Fig. 4.11 Simulated flow patterns in the pulsed beds under different frequencies. Snapshots correspond to f = 2, 3, 4 and 5 Hz, from (a) to (d). Offset A = 1 and amplitude B = 0.4. Reproduced
from [61]