

4.3 Results and Discussion
109
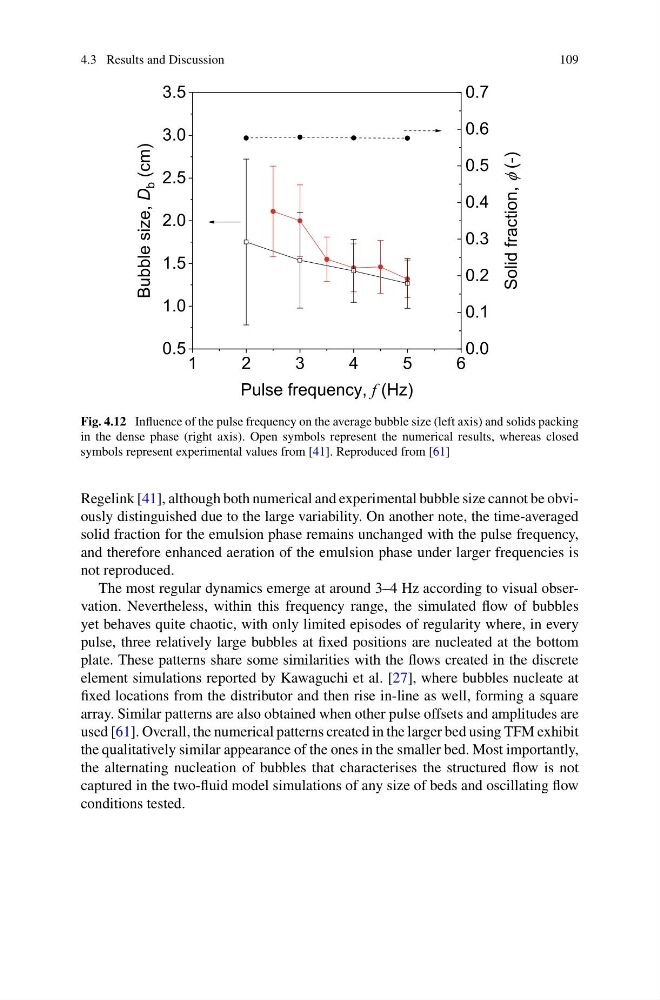
Fig. 4.12 Influence of the pulse frequency on the average bubble size (left axis) and solids packing
in the dense phase (right axis). Open symbols represent the numerical results, whereas closed
symbols represent experimental values from [41]. Reproduced from [61]
Regelink [41], although both numerical and experimental bubble size cannot be obviously distinguished due to the large variability. On another note, the time-averaged
solid fraction for the emulsion phase remains unchanged with the pulse frequency,
and therefore enhanced aeration of the emulsion phase under larger frequencies is
not reproduced.
The most regular dynamics emerge at around 3–4 Hz according to visual observation. Nevertheless, within this frequency range, the simulated flow of bubbles
yet behaves quite chaotic, with only limited episodes of regularity where, in every
pulse, three relatively large bubbles at fixed positions are nucleated at the bottom
plate. These patterns share some similarities with the flows created in the discrete
element simulations reported by Kawaguchi et al. [27], where bubbles nucleate at
fixed locations from the distributor and then rise in-line as well, forming a square
array. Similar patterns are also obtained when other pulse offsets and amplitudes are
used [61]. Overall, the numerical patterns created in the larger bed using TFM exhibit
the qualitatively similar appearance of the ones in the smaller bed. Most importantly,
the alternating nucleation of bubbles that characterises the structured flow is not
captured in the two-fluid model simulations of any size of beds and oscillating flow
conditions tested.
109
Fig. 4.12 Influence of the pulse frequency on the average bubble size (left axis) and solids packing
in the dense phase (right axis). Open symbols represent the numerical results, whereas closed
symbols represent experimental values from [41]. Reproduced from [61]
Regelink [41], although both numerical and experimental bubble size cannot be obviously distinguished due to the large variability. On another note, the time-averaged
solid fraction for the emulsion phase remains unchanged with the pulse frequency,
and therefore enhanced aeration of the emulsion phase under larger frequencies is
not reproduced.
The most regular dynamics emerge at around 3–4 Hz according to visual observation. Nevertheless, within this frequency range, the simulated flow of bubbles
yet behaves quite chaotic, with only limited episodes of regularity where, in every
pulse, three relatively large bubbles at fixed positions are nucleated at the bottom
plate. These patterns share some similarities with the flows created in the discrete
element simulations reported by Kawaguchi et al. [27], where bubbles nucleate at
fixed locations from the distributor and then rise in-line as well, forming a square
array. Similar patterns are also obtained when other pulse offsets and amplitudes are
used [61]. Overall, the numerical patterns created in the larger bed using TFM exhibit
the qualitatively similar appearance of the ones in the smaller bed. Most importantly,
the alternating nucleation of bubbles that characterises the structured flow is not
captured in the two-fluid model simulations of any size of beds and oscillating flow
conditions tested.