

4.3 Results and Discussion
105
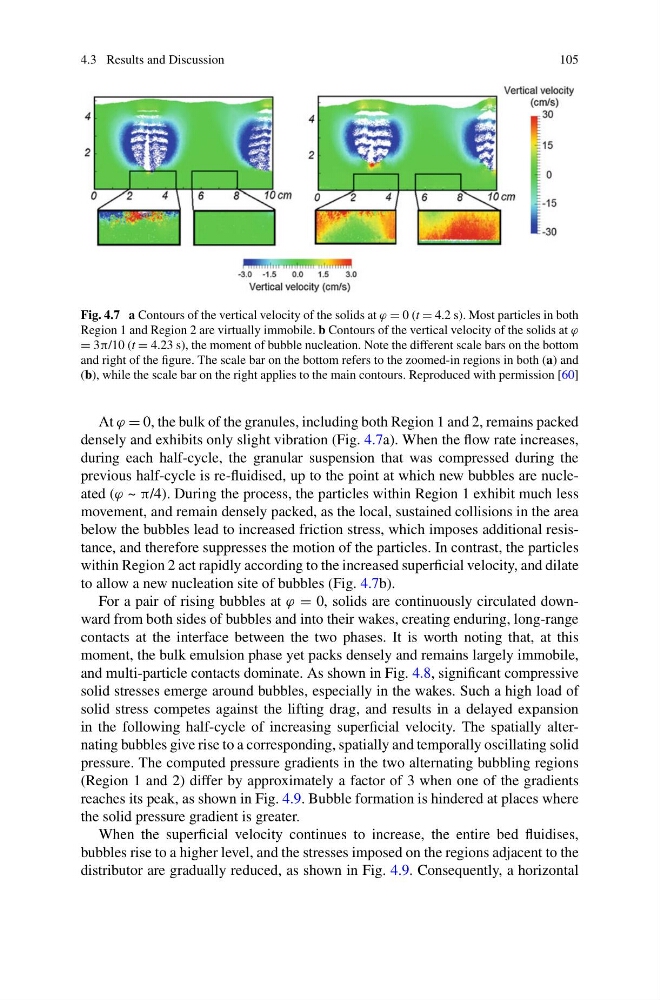
Fig. 4.7 a Contours of the vertical velocity of the solids at ϕ = 0 (t = 4.2 s). Most particles in both
Region 1 and Region 2 are virtually immobile. b Contours of the vertical velocity of the solids at ϕ
= 3π/10 (t = 4.23 s), the moment of bubble nucleation. Note the different scale bars on the bottom
and right of the figure. The scale bar on the bottom refers to the zoomed-in regions in both (a) and
(b), while the scale bar on the right applies to the main contours. Reproduced with permission [60]
At ϕ = 0, the bulk of the granules, including both Region 1 and 2, remains packed
densely and exhibits only slight vibration (Fig. 4.7a). When the flow rate increases,
during each half-cycle, the granular suspension that was compressed during the
previous half-cycle is re-fluidised, up to the point at which new bubbles are nucleated (ϕ ~ π/4). During the process, the particles within Region 1 exhibit much less
movement, and remain densely packed, as the local, sustained collisions in the area
below the bubbles lead to increased friction stress, which imposes additional resistance, and therefore suppresses the motion of the particles. In contrast, the particles
within Region 2 act rapidly according to the increased superficial velocity, and dilate
to allow a new nucleation site of bubbles (Fig. 4.7b).
For a pair of rising bubbles at ϕ = 0, solids are continuously circulated downward from both sides of bubbles and into their wakes, creating enduring, long-range
contacts at the interface between the two phases. It is worth noting that, at this
moment, the bulk emulsion phase yet packs densely and remains largely immobile,
and multi-particle contacts dominate. As shown in Fig. 4.8, significant compressive
solid stresses emerge around bubbles, especially in the wakes. Such a high load of
solid stress competes against the lifting drag, and results in a delayed expansion
in the following half-cycle of increasing superficial velocity. The spatially alternating bubbles give rise to a corresponding, spatially and temporally oscillating solid
pressure. The computed pressure gradients in the two alternating bubbling regions
(Region 1 and 2) differ by approximately a factor of 3 when one of the gradients
reaches its peak, as shown in Fig. 4.9. Bubble formation is hindered at places where
the solid pressure gradient is greater.
When the superficial velocity continues to increase, the entire bed fluidises,
bubbles rise to a higher level, and the stresses imposed on the regions adjacent to the
distributor are gradually reduced, as shown in Fig. 4.9. Consequently, a horizontal
105
Fig. 4.7 a Contours of the vertical velocity of the solids at ϕ = 0 (t = 4.2 s). Most particles in both
Region 1 and Region 2 are virtually immobile. b Contours of the vertical velocity of the solids at ϕ
= 3π/10 (t = 4.23 s), the moment of bubble nucleation. Note the different scale bars on the bottom
and right of the figure. The scale bar on the bottom refers to the zoomed-in regions in both (a) and
(b), while the scale bar on the right applies to the main contours. Reproduced with permission [60]
At ϕ = 0, the bulk of the granules, including both Region 1 and 2, remains packed
densely and exhibits only slight vibration (Fig. 4.7a). When the flow rate increases,
during each half-cycle, the granular suspension that was compressed during the
previous half-cycle is re-fluidised, up to the point at which new bubbles are nucleated (ϕ ~ π/4). During the process, the particles within Region 1 exhibit much less
movement, and remain densely packed, as the local, sustained collisions in the area
below the bubbles lead to increased friction stress, which imposes additional resistance, and therefore suppresses the motion of the particles. In contrast, the particles
within Region 2 act rapidly according to the increased superficial velocity, and dilate
to allow a new nucleation site of bubbles (Fig. 4.7b).
For a pair of rising bubbles at ϕ = 0, solids are continuously circulated downward from both sides of bubbles and into their wakes, creating enduring, long-range
contacts at the interface between the two phases. It is worth noting that, at this
moment, the bulk emulsion phase yet packs densely and remains largely immobile,
and multi-particle contacts dominate. As shown in Fig. 4.8, significant compressive
solid stresses emerge around bubbles, especially in the wakes. Such a high load of
solid stress competes against the lifting drag, and results in a delayed expansion
in the following half-cycle of increasing superficial velocity. The spatially alternating bubbles give rise to a corresponding, spatially and temporally oscillating solid
pressure. The computed pressure gradients in the two alternating bubbling regions
(Region 1 and 2) differ by approximately a factor of 3 when one of the gradients
reaches its peak, as shown in Fig. 4.9. Bubble formation is hindered at places where
the solid pressure gradient is greater.
When the superficial velocity continues to increase, the entire bed fluidises,
bubbles rise to a higher level, and the stresses imposed on the regions adjacent to the
distributor are gradually reduced, as shown in Fig. 4.9. Consequently, a horizontal