

104
4 Modelling Dynamically Structured Fluidisation
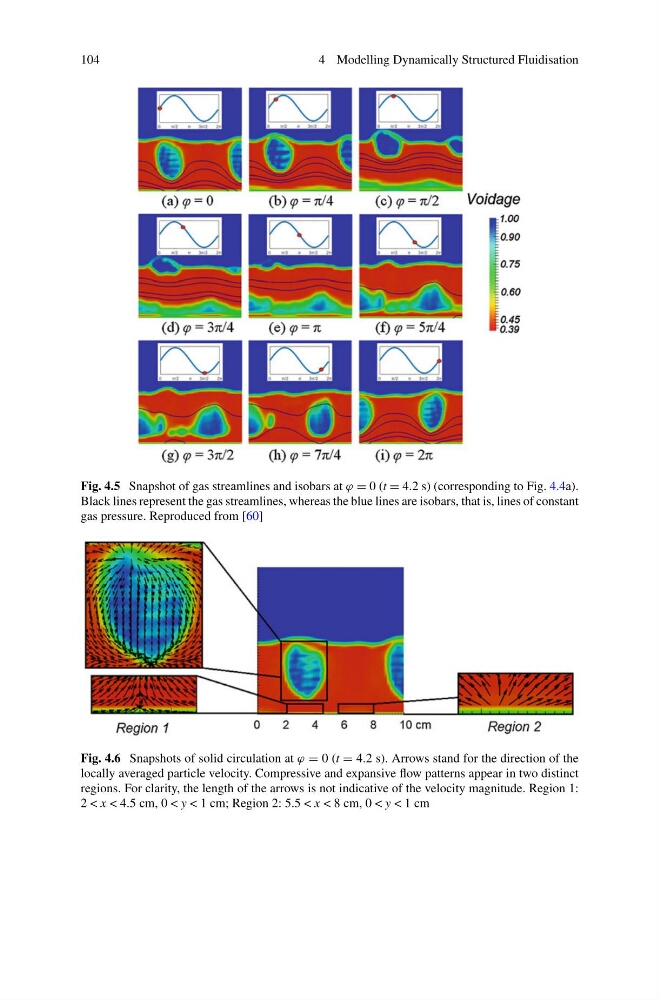
Fig. 4.5 Snapshot of gas streamlines and isobars at ϕ = 0 (t = 4.2 s) (corresponding to Fig. 4.4a).
Black lines represent the gas streamlines, whereas the blue lines are isobars, that is, lines of constant
gas pressure. Reproduced from [60]
Fig. 4.6 Snapshots of solid circulation at ϕ = 0 (t = 4.2 s). Arrows stand for the direction of the
locally averaged particle velocity. Compressive and expansive flow patterns appear in two distinct
regions. For clarity, the length of the arrows is not indicative of the velocity magnitude. Region 1:
2 < x < 4.5 cm, 0 < y < 1 cm; Region 2: 5.5 < x < 8 cm, 0 < y < 1 cm
4 Modelling Dynamically Structured Fluidisation
Fig. 4.5 Snapshot of gas streamlines and isobars at ϕ = 0 (t = 4.2 s) (corresponding to Fig. 4.4a).
Black lines represent the gas streamlines, whereas the blue lines are isobars, that is, lines of constant
gas pressure. Reproduced from [60]
Fig. 4.6 Snapshots of solid circulation at ϕ = 0 (t = 4.2 s). Arrows stand for the direction of the
locally averaged particle velocity. Compressive and expansive flow patterns appear in two distinct
regions. For clarity, the length of the arrows is not indicative of the velocity magnitude. Region 1:
2 < x < 4.5 cm, 0 < y < 1 cm; Region 2: 5.5 < x < 8 cm, 0 < y < 1 cm