

4.3 Results and Discussion
103
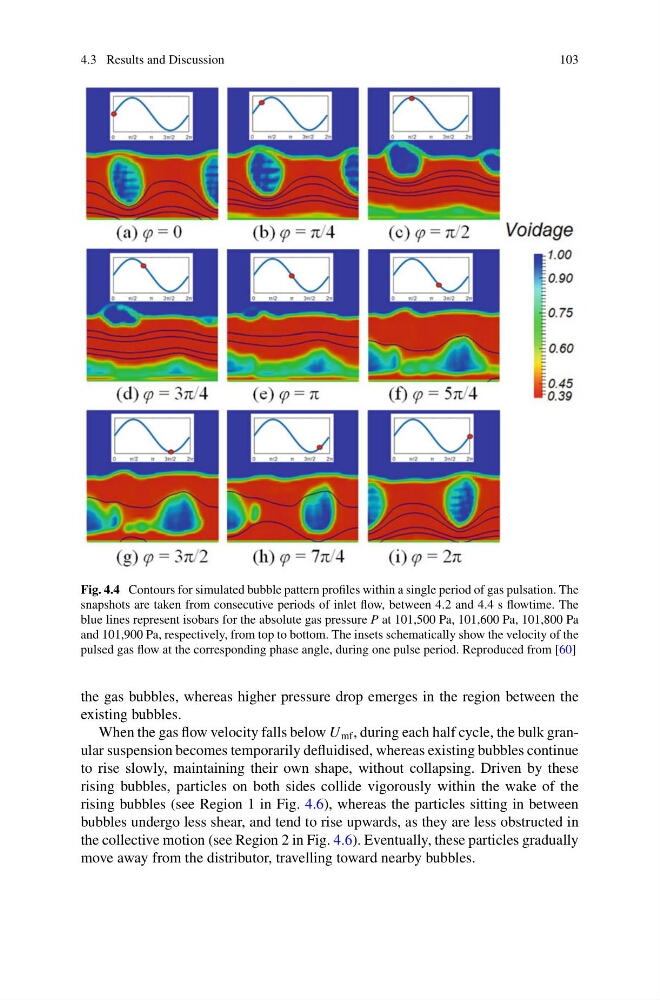
Fig. 4.4 Contours for simulated bubble pattern profiles within a single period of gas pulsation. The
snapshots are taken from consecutive periods of inlet flow, between 4.2 and 4.4 s flowtime. The
blue lines represent isobars for the absolute gas pressure P at 101,500 Pa, 101,600 Pa, 101,800 Pa
and 101,900 Pa, respectively, from top to bottom. The insets schematically show the velocity of the
pulsed gas flow at the corresponding phase angle, during one pulse period. Reproduced from [60]
the gas bubbles, whereas higher pressure drop emerges in the region between the
existing bubbles.
When the gas flow velocity falls below U mf , during each half cycle, the bulk granular suspension becomes temporarily defluidised, whereas existing bubbles continue
to rise slowly, maintaining their own shape, without collapsing. Driven by these
rising bubbles, particles on both sides collide vigorously within the wake of the
rising bubbles (see Region 1 in Fig. 4.6), whereas the particles sitting in between
bubbles undergo less shear, and tend to rise upwards, as they are less obstructed in
the collective motion (see Region 2 in Fig. 4.6). Eventually, these particles gradually
move away from the distributor, travelling toward nearby bubbles.
103
Fig. 4.4 Contours for simulated bubble pattern profiles within a single period of gas pulsation. The
snapshots are taken from consecutive periods of inlet flow, between 4.2 and 4.4 s flowtime. The
blue lines represent isobars for the absolute gas pressure P at 101,500 Pa, 101,600 Pa, 101,800 Pa
and 101,900 Pa, respectively, from top to bottom. The insets schematically show the velocity of the
pulsed gas flow at the corresponding phase angle, during one pulse period. Reproduced from [60]
the gas bubbles, whereas higher pressure drop emerges in the region between the
existing bubbles.
When the gas flow velocity falls below U mf , during each half cycle, the bulk granular suspension becomes temporarily defluidised, whereas existing bubbles continue
to rise slowly, maintaining their own shape, without collapsing. Driven by these
rising bubbles, particles on both sides collide vigorously within the wake of the
rising bubbles (see Region 1 in Fig. 4.6), whereas the particles sitting in between
bubbles undergo less shear, and tend to rise upwards, as they are less obstructed in
the collective motion (see Region 2 in Fig. 4.6). Eventually, these particles gradually
move away from the distributor, travelling toward nearby bubbles.