

102
4 Modelling Dynamically Structured Fluidisation
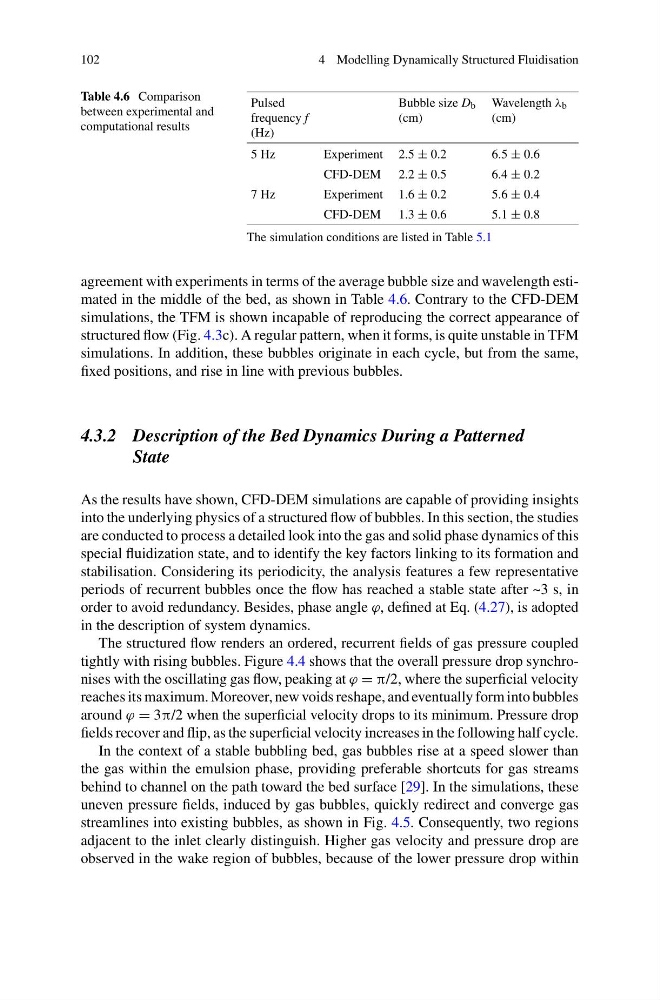
Table 4.6 Comparison
between experimental and
computational results
Pulsed
frequency f
(Hz)
Bubble size D b
(cm)
Wavelength λ b
(cm)
5 Hz
Experiment 2.5 ± 0.2
6.5 ± 0.6
CFD-DEM 2.2 ± 0.5
6.4 ± 0.2
7 Hz
Experiment 1.6 ± 0.2
5.6 ± 0.4
CFD-DEM 1.3 ± 0.6
5.1 ± 0.8
The simulation conditions are listed in Table 5.1
agreement with experiments in terms of the average bubble size and wavelength estimated in the middle of the bed, as shown in Table 4.6. Contrary to the CFD-DEM
simulations, the TFM is shown incapable of reproducing the correct appearance of
structured flow (Fig. 4.3c). A regular pattern, when it forms, is quite unstable in TFM
simulations. In addition, these bubbles originate in each cycle, but from the same,
fixed positions, and rise in line with previous bubbles.
4.3.2 Description of the Bed Dynamics During a Patterned
State
As the results have shown, CFD-DEM simulations are capable of providing insights
into the underlying physics of a structured flow of bubbles. In this section, the studies
are conducted to process a detailed look into the gas and solid phase dynamics of this
special fluidization state, and to identify the key factors linking to its formation and
stabilisation. Considering its periodicity, the analysis features a few representative
periods of recurrent bubbles once the flow has reached a stable state after ~3 s, in
order to avoid redundancy. Besides, phase angle ϕ, defined at Eq. (4.27), is adopted
in the description of system dynamics.
The structured flow renders an ordered, recurrent fields of gas pressure coupled
tightly with rising bubbles. Figure 4.4 shows that the overall pressure drop synchronises with the oscillating gas flow, peaking at ϕ = π/2, where the superficial velocity
reaches its maximum. Moreover, new voids reshape, and eventually form into bubbles
around ϕ = 3π/2 when the superficial velocity drops to its minimum. Pressure drop
fields recover and flip, as the superficial velocity increases in the following half cycle.
In the context of a stable bubbling bed, gas bubbles rise at a speed slower than
the gas within the emulsion phase, providing preferable shortcuts for gas streams
behind to channel on the path toward the bed surface [29]. In the simulations, these
uneven pressure fields, induced by gas bubbles, quickly redirect and converge gas
streamlines into existing bubbles, as shown in Fig. 4.5. Consequently, two regions
adjacent to the inlet clearly distinguish. Higher gas velocity and pressure drop are
observed in the wake region of bubbles, because of the lower pressure drop within
4 Modelling Dynamically Structured Fluidisation
Table 4.6 Comparison
between experimental and
computational results
Pulsed
frequency f
(Hz)
Bubble size D b
(cm)
Wavelength λ b
(cm)
5 Hz
Experiment 2.5 ± 0.2
6.5 ± 0.6
CFD-DEM 2.2 ± 0.5
6.4 ± 0.2
7 Hz
Experiment 1.6 ± 0.2
5.6 ± 0.4
CFD-DEM 1.3 ± 0.6
5.1 ± 0.8
The simulation conditions are listed in Table 5.1
agreement with experiments in terms of the average bubble size and wavelength estimated in the middle of the bed, as shown in Table 4.6. Contrary to the CFD-DEM
simulations, the TFM is shown incapable of reproducing the correct appearance of
structured flow (Fig. 4.3c). A regular pattern, when it forms, is quite unstable in TFM
simulations. In addition, these bubbles originate in each cycle, but from the same,
fixed positions, and rise in line with previous bubbles.
4.3.2 Description of the Bed Dynamics During a Patterned
State
As the results have shown, CFD-DEM simulations are capable of providing insights
into the underlying physics of a structured flow of bubbles. In this section, the studies
are conducted to process a detailed look into the gas and solid phase dynamics of this
special fluidization state, and to identify the key factors linking to its formation and
stabilisation. Considering its periodicity, the analysis features a few representative
periods of recurrent bubbles once the flow has reached a stable state after ~3 s, in
order to avoid redundancy. Besides, phase angle ϕ, defined at Eq. (4.27), is adopted
in the description of system dynamics.
The structured flow renders an ordered, recurrent fields of gas pressure coupled
tightly with rising bubbles. Figure 4.4 shows that the overall pressure drop synchronises with the oscillating gas flow, peaking at ϕ = π/2, where the superficial velocity
reaches its maximum. Moreover, new voids reshape, and eventually form into bubbles
around ϕ = 3π/2 when the superficial velocity drops to its minimum. Pressure drop
fields recover and flip, as the superficial velocity increases in the following half cycle.
In the context of a stable bubbling bed, gas bubbles rise at a speed slower than
the gas within the emulsion phase, providing preferable shortcuts for gas streams
behind to channel on the path toward the bed surface [29]. In the simulations, these
uneven pressure fields, induced by gas bubbles, quickly redirect and converge gas
streamlines into existing bubbles, as shown in Fig. 4.5. Consequently, two regions
adjacent to the inlet clearly distinguish. Higher gas velocity and pressure drop are
observed in the wake region of bubbles, because of the lower pressure drop within