

4.3 Results and Discussion
101
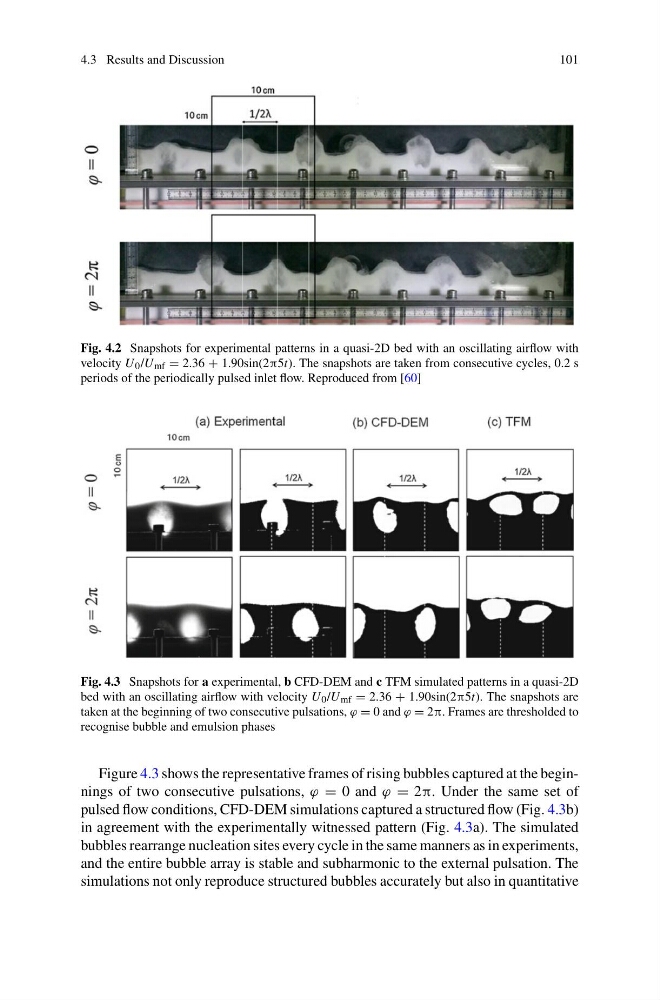
Fig. 4.2 Snapshots for experimental patterns in a quasi-2D bed with an oscillating airflow with
velocity U 0 /U mf = 2.36 + 1.90sin(2π5t). The snapshots are taken from consecutive cycles, 0.2 s
periods of the periodically pulsed inlet flow. Reproduced from [60]
Fig. 4.3 Snapshots for a experimental, b CFD-DEM and c TFM simulated patterns in a quasi-2D
bed with an oscillating airflow with velocity U 0 /U mf = 2.36 + 1.90sin(2π5t). The snapshots are
taken at the beginning of two consecutive pulsations, ϕ = 0 and ϕ = 2π. Frames are thresholded to
recognise bubble and emulsion phases
Figure 4.3 shows the representative frames of rising bubbles captured at the beginnings of two consecutive pulsations, ϕ = 0 and ϕ = 2π. Under the same set of
pulsed flow conditions, CFD-DEM simulations captured a structured flow (Fig. 4.3b)
in agreement with the experimentally witnessed pattern (Fig. 4.3a). The simulated
bubbles rearrange nucleation sites every cycle in the same manners as in experiments,
and the entire bubble array is stable and subharmonic to the external pulsation. The
simulations not only reproduce structured bubbles accurately but also in quantitative
101
Fig. 4.2 Snapshots for experimental patterns in a quasi-2D bed with an oscillating airflow with
velocity U 0 /U mf = 2.36 + 1.90sin(2π5t). The snapshots are taken from consecutive cycles, 0.2 s
periods of the periodically pulsed inlet flow. Reproduced from [60]
Fig. 4.3 Snapshots for a experimental, b CFD-DEM and c TFM simulated patterns in a quasi-2D
bed with an oscillating airflow with velocity U 0 /U mf = 2.36 + 1.90sin(2π5t). The snapshots are
taken at the beginning of two consecutive pulsations, ϕ = 0 and ϕ = 2π. Frames are thresholded to
recognise bubble and emulsion phases
Figure 4.3 shows the representative frames of rising bubbles captured at the beginnings of two consecutive pulsations, ϕ = 0 and ϕ = 2π. Under the same set of
pulsed flow conditions, CFD-DEM simulations captured a structured flow (Fig. 4.3b)
in agreement with the experimentally witnessed pattern (Fig. 4.3a). The simulated
bubbles rearrange nucleation sites every cycle in the same manners as in experiments,
and the entire bubble array is stable and subharmonic to the external pulsation. The
simulations not only reproduce structured bubbles accurately but also in quantitative