

4.2 Model Implementation
99
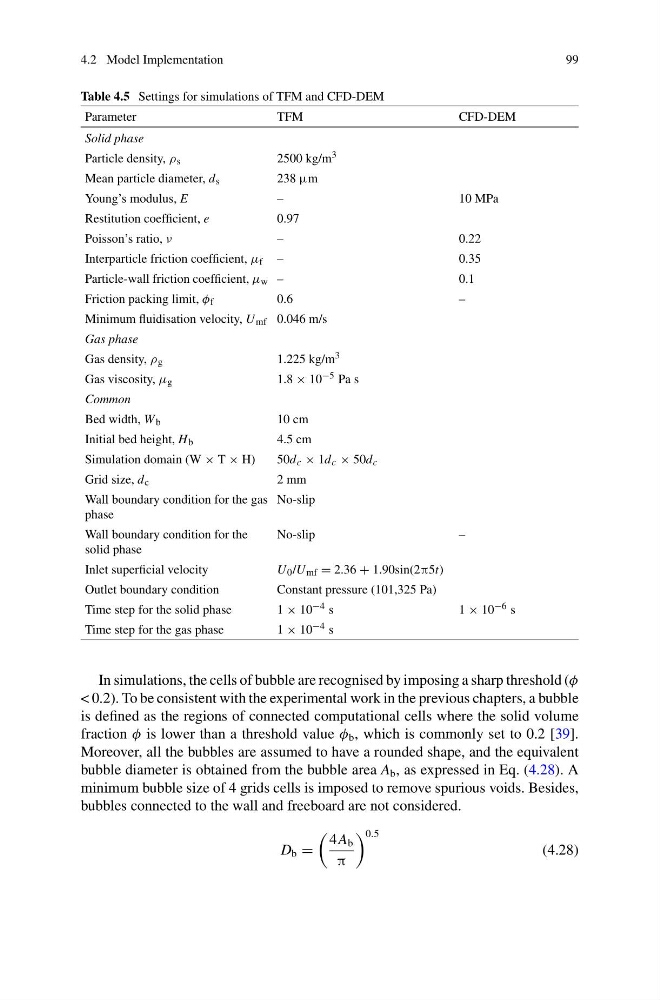
Table 4.5 Settings for simulations of TFM and CFD-DEM
Parameter
TFM
CFD-DEM
Solid phase
Particle density, ρ s
2500 kg/m 3
Mean particle diameter, d s
238 μm
Young’s modulus, E
–
1 0 M P a
Restitution coefficient, e
0.97
Poisson’s ratio, ν
–
0 . 2 2
Interparticle friction coefficient, μ f –
0 . 3 5
Particle-wall friction coefficient, μ w –
0 . 1
Friction packing limit, φ f
0.6
–
Minimum fluidisation velocity, U mf 0.046 m/s
Gas phase
Gas density, ρ g
1.225 kg/m 3
Gas viscosity, μ g
1.8 × 10 −5 Pa s
Common
Bed width, W b
10 cm
Initial bed height, H b
4.5 cm
Simulation domain (W × T × H)
50d c × 1d c × 50d c
Grid size, d c
2 mm
Wall boundary condition for the gas
phase
No-slip
Wall boundary condition for the
solid phase
No-slip
–
Inlet superficial velocity
U 0 /U mf = 2.36 + 1.90sin(2π5t)
Outlet boundary condition
Constant pressure (101,325 Pa)
Time step for the solid phase
1 × 10 −4 s
1 × 10 −6 s
Time step for the gas phase
1 × 10 −4 s
In simulations, the cells of bubble are recognised by imposing a sharp threshold (φ
< 0.2). To be consistent with the experimental work in the previous chapters, a bubble
is defined as the regions of connected computational cells where the solid volume
fraction φ is lower than a threshold value φ b , which is commonly set to 0.2 [39].
Moreover, all the bubbles are assumed to have a rounded shape, and the equivalent
bubble diameter is obtained from the bubble area A b , as expressed in Eq. (4.28). A
minimum bubble size of 4 grids cells is imposed to remove spurious voids. Besides,
bubbles connected to the wall and freeboard are not considered.
D b =
4 A b
π
0.5
(4.28)
99
Table 4.5 Settings for simulations of TFM and CFD-DEM
Parameter
TFM
CFD-DEM
Solid phase
Particle density, ρ s
2500 kg/m 3
Mean particle diameter, d s
238 μm
Young’s modulus, E
–
1 0 M P a
Restitution coefficient, e
0.97
Poisson’s ratio, ν
–
0 . 2 2
Interparticle friction coefficient, μ f –
0 . 3 5
Particle-wall friction coefficient, μ w –
0 . 1
Friction packing limit, φ f
0.6
–
Minimum fluidisation velocity, U mf 0.046 m/s
Gas phase
Gas density, ρ g
1.225 kg/m 3
Gas viscosity, μ g
1.8 × 10 −5 Pa s
Common
Bed width, W b
10 cm
Initial bed height, H b
4.5 cm
Simulation domain (W × T × H)
50d c × 1d c × 50d c
Grid size, d c
2 mm
Wall boundary condition for the gas
phase
No-slip
Wall boundary condition for the
solid phase
No-slip
–
Inlet superficial velocity
U 0 /U mf = 2.36 + 1.90sin(2π5t)
Outlet boundary condition
Constant pressure (101,325 Pa)
Time step for the solid phase
1 × 10 −4 s
1 × 10 −6 s
Time step for the gas phase
1 × 10 −4 s
In simulations, the cells of bubble are recognised by imposing a sharp threshold (φ
< 0.2). To be consistent with the experimental work in the previous chapters, a bubble
is defined as the regions of connected computational cells where the solid volume
fraction φ is lower than a threshold value φ b , which is commonly set to 0.2 [39].
Moreover, all the bubbles are assumed to have a rounded shape, and the equivalent
bubble diameter is obtained from the bubble area A b , as expressed in Eq. (4.28). A
minimum bubble size of 4 grids cells is imposed to remove spurious voids. Besides,
bubbles connected to the wall and freeboard are not considered.
D b =
4 A b
π
0.5
(4.28)