

probability of any event occurring can be determined by plotting the individual
values on probability paper. Either an arithmetic normality or a geometric normality
may be plotted. This is accomplished by arranging the individual data points in
ascending (or descending) order of magnitude. The probability of recurrence of any
value then is the order of magnitude of that event divided by the total number of
events plus 1. These values can then be plotted on a graph similar to Fig. 6.7. To
determine the probability of any event exceeding (or being less than) a given value,
one needs only to refer to the probability curve. The mean value is that which is
exceeded every other year as a statistical average and this produces a mean value at
the 50% occurrence. For a value that would be exceeded once in 10 yr, one would
refer to the 90% level and for once every 100 yr refer to the 99-yr probability and so
on. It must be remembered that these are statistical values. Figure 6.7 was plotted
from 26 actually measured values. It may be seen that the upper end of the curve
does not fit the data points. Furthermore, there is nothing to prevent a 100-yr
occurrence from happening 2 yr in a row. The information merely provides data
upon which the engineer can design a facility or a structure to handle the worst
anticipated problem in a given period of time. The value of the structure and the
value of the potential property damage must all be taken into account. For example, a
dam should be constructed to handle the worst possible conditions, whereas a small
storm drain could be designed to overflow on an average of once every 20 yr if there
would be no significant damage caused by such flooding. Obviously, social concerns
must also be considered, not just the financial aspect.
4 Evaporation
Evaporation is the formation of water vapor. Strictly speaking, it is the formation of
water vapor from a liquid surface; however, for the sake of this discussion, evaporation here will also include evaporation from the solid state or ice, which technically
is called sublimation.
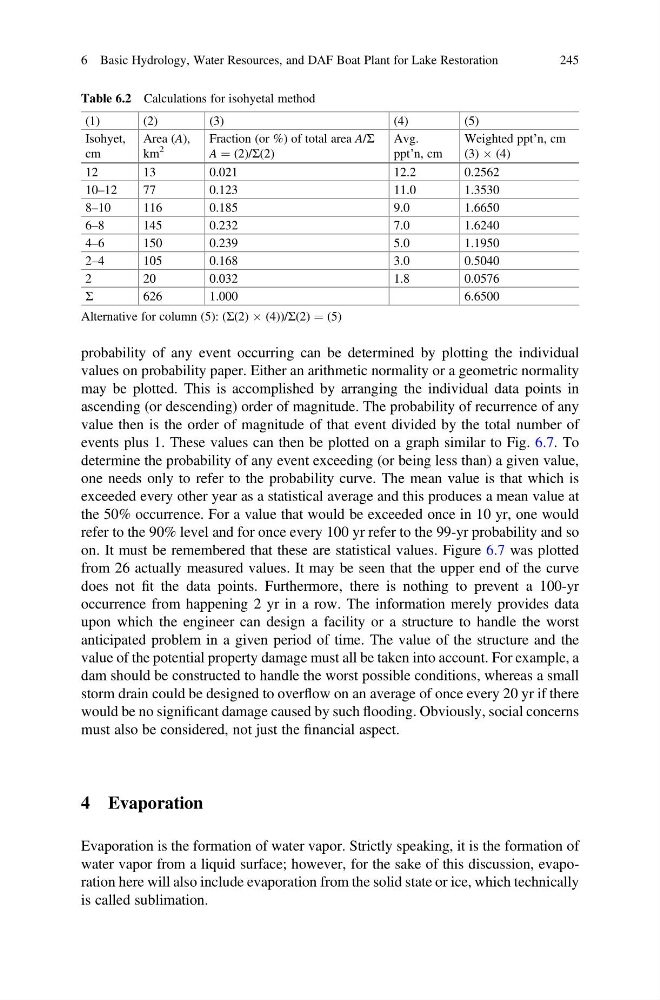
Table 6.2 Calculations for isohyetal method
(1)
(2)
(3)
(4)
(5)
Isohyet,
cm
Area (A),
km
2
Fraction (or %) of total area A/Σ
A ¼ (2)/Σ(2)
Avg.
ppt’n, cm
Weighted ppt’n, cm
(3) Â (4)
12
13
0.021
12.2
0.2562
10–12
77
0.123
11.0
1.3530
8–10
116
0.185
9.0
1.6650
6–8
145
0.232
7.0
1.6240
4–6
150
0.239
5.0
1.1950
2–4
105
0.168
3.0
0.5040
2
20
0.032
1.8
0.0576
Σ
626
1.000
6.6500
Alternative for column (5): (Σ(2) Â (4))/Σ(2) ¼ (5)
6 Basic Hydrology, Water Resources, and DAF Boat Plant for Lake Restoration
245
values on probability paper. Either an arithmetic normality or a geometric normality
may be plotted. This is accomplished by arranging the individual data points in
ascending (or descending) order of magnitude. The probability of recurrence of any
value then is the order of magnitude of that event divided by the total number of
events plus 1. These values can then be plotted on a graph similar to Fig. 6.7. To
determine the probability of any event exceeding (or being less than) a given value,
one needs only to refer to the probability curve. The mean value is that which is
exceeded every other year as a statistical average and this produces a mean value at
the 50% occurrence. For a value that would be exceeded once in 10 yr, one would
refer to the 90% level and for once every 100 yr refer to the 99-yr probability and so
on. It must be remembered that these are statistical values. Figure 6.7 was plotted
from 26 actually measured values. It may be seen that the upper end of the curve
does not fit the data points. Furthermore, there is nothing to prevent a 100-yr
occurrence from happening 2 yr in a row. The information merely provides data
upon which the engineer can design a facility or a structure to handle the worst
anticipated problem in a given period of time. The value of the structure and the
value of the potential property damage must all be taken into account. For example, a
dam should be constructed to handle the worst possible conditions, whereas a small
storm drain could be designed to overflow on an average of once every 20 yr if there
would be no significant damage caused by such flooding. Obviously, social concerns
must also be considered, not just the financial aspect.
4 Evaporation
Evaporation is the formation of water vapor. Strictly speaking, it is the formation of
water vapor from a liquid surface; however, for the sake of this discussion, evaporation here will also include evaporation from the solid state or ice, which technically
is called sublimation.
Table 6.2 Calculations for isohyetal method
(1)
(2)
(3)
(4)
(5)
Isohyet,
cm
Area (A),
km
2
Fraction (or %) of total area A/Σ
A ¼ (2)/Σ(2)
Avg.
ppt’n, cm
Weighted ppt’n, cm
(3) Â (4)
12
13
0.021
12.2
0.2562
10–12
77
0.123
11.0
1.3530
8–10
116
0.185
9.0
1.6650
6–8
145
0.232
7.0
1.6240
4–6
150
0.239
5.0
1.1950
2–4
105
0.168
3.0
0.5040
2
20
0.032
1.8
0.0576
Σ
626
1.000
6.6500
Alternative for column (5): (Σ(2) Â (4))/Σ(2) ¼ (5)
6 Basic Hydrology, Water Resources, and DAF Boat Plant for Lake Restoration
245