

Surface Heat Transfer Coefficient
An expression has been derived for the surface heat transfer coefficient, K, by means
of a balance of the rates of heat exchange at the pond surface. This expression can be
manipulated and several approximations made to arrive at the following definition of
K [3]:
K ¼ 92:5 þ C 1 þ β
ð
Þf U
ð Þ
ð5:5Þ
where K is surface heat transfer coefficient (Kcal/d-m
2 -
C), 92.5 is back radiation,
C1 is Bowen’s conduction-evaporation coefficient (0.468 mm Hg
C), β is slope of
the saturated vapor pressure curve between the dew point temperature and the pond
surface temperature (mm Hg
C), and f(U ) is evaporative wind speed function,
(Kcal/d-m
2 -mm Hg).
Equation (5.5) defines the surface heat transfer coefficient in terms of three
components. These three components approximately represent the sum of heat
dissipation from back radiation, conduction, and evaporation.
Relationship for the Slope of the Saturated Vapor Pressure Curve, β
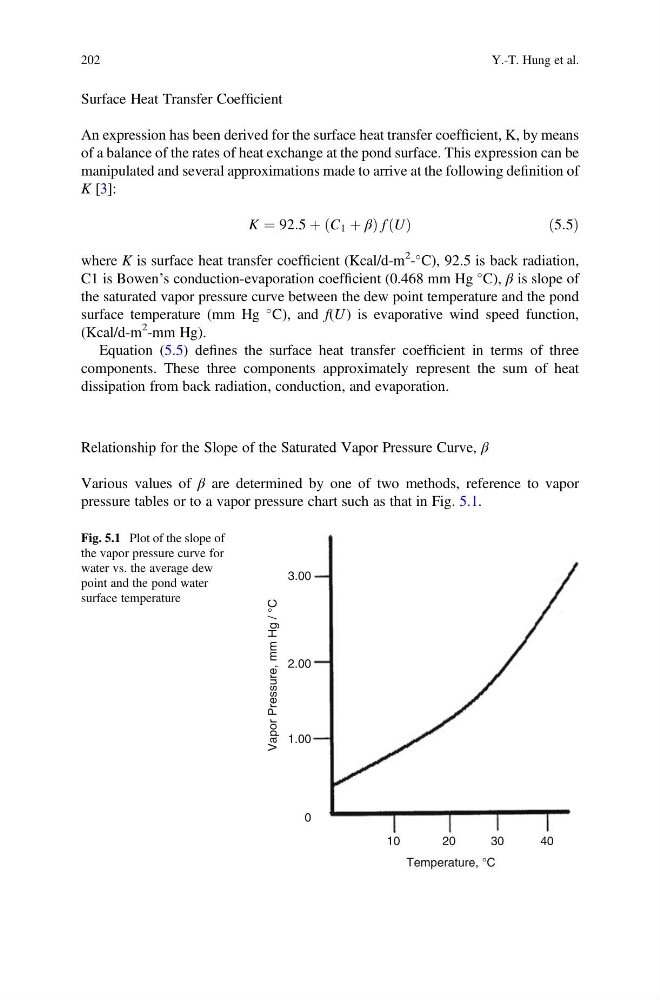
Various values of β are determined by one of two methods, reference to vapor
pressure tables or to a vapor pressure chart such as that in Fig. 5.1.
10
0
1.00
2.00
3.00
20
30
Temperature, °C
Vapor Pressure, mm Hg / °C
40
Fig. 5.1 Plot of the slope of
the vapor pressure curve for
water vs. the average dew
point and the pond water
surface temperature
202
Y.-T. Hung et al.
An expression has been derived for the surface heat transfer coefficient, K, by means
of a balance of the rates of heat exchange at the pond surface. This expression can be
manipulated and several approximations made to arrive at the following definition of
K [3]:
K ¼ 92:5 þ C 1 þ β
ð
Þf U
ð Þ
ð5:5Þ
where K is surface heat transfer coefficient (Kcal/d-m
2 -
C), 92.5 is back radiation,
C1 is Bowen’s conduction-evaporation coefficient (0.468 mm Hg
C), β is slope of
the saturated vapor pressure curve between the dew point temperature and the pond
surface temperature (mm Hg
C), and f(U ) is evaporative wind speed function,
(Kcal/d-m
2 -mm Hg).
Equation (5.5) defines the surface heat transfer coefficient in terms of three
components. These three components approximately represent the sum of heat
dissipation from back radiation, conduction, and evaporation.
Relationship for the Slope of the Saturated Vapor Pressure Curve, β
Various values of β are determined by one of two methods, reference to vapor
pressure tables or to a vapor pressure chart such as that in Fig. 5.1.
10
0
1.00
2.00
3.00
20
30
Temperature, °C
Vapor Pressure, mm Hg / °C
40
Fig. 5.1 Plot of the slope of
the vapor pressure curve for
water vs. the average dew
point and the pond water
surface temperature
202
Y.-T. Hung et al.