

2 Interparticle Interactions: Theory and Mesoscopic Modeling
59
the anisotropy constant k Co is always 1. The dipolar interaction strength is taken g
= 0.1.
Periodic boundary conditions were used and the lattice was repeated periodically.
We implemented the Ewald summation technique for the calculation of the longrange dipolar interactions so the values of the dipolar interaction tensor (D ij ) were
the same used in the Ewald matrix.
2.2.3.2 Results and Discussion
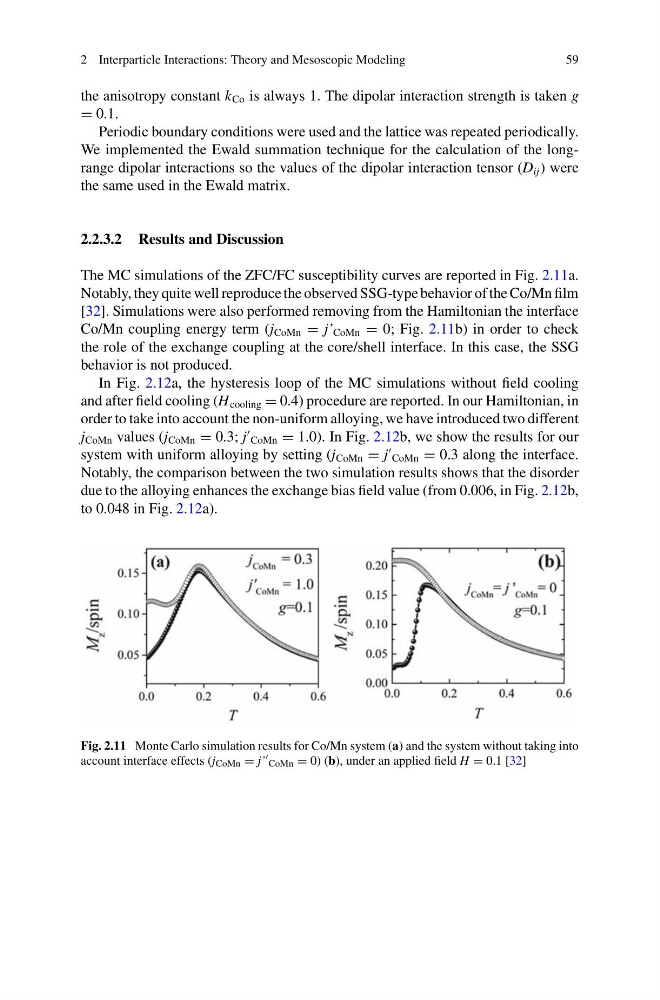
The MC simulations of the ZFC/FC susceptibility curves are reported in Fig. 2.11a.
Notably, they quite well reproduce the observed SSG-type behavior of the Co/Mn film
[32]. Simulations were also performed removing from the Hamiltonian the interface
Co/Mn coupling energy term (j CoMn = j’ CoMn = 0; Fig. 2.11b) in order to check
the role of the exchange coupling at the core/shell interface. In this case, the SSG
behavior is not produced.
In Fig. 2.12a, the hysteresis loop of the MC simulations without field cooling
and after field cooling (H cooling = 0.4) procedure are reported. In our Hamiltonian, in
order to take into account the non-uniform alloying, we have introduced two different
j CoMn values (j CoMn = 0.3; j
CoMn = 1.0). In Fig. 2.12b, we show the results for our
system with uniform alloying by setting (j CoMn = j
CoMn = 0.3 along the interface.
Notably, the comparison between the two simulation results shows that the disorder
due to the alloying enhances the exchange bias field value (from 0.006, in Fig. 2.12b,
to 0.048 in Fig. 2.12a).
Fig. 2.11 Monte Carlo simulation results for Co/Mn system (a) and the system without taking into
account interface effects (j CoMn = j’ CoMn = 0) (b), under an applied field H = 0.1 [32]
59
the anisotropy constant k Co is always 1. The dipolar interaction strength is taken g
= 0.1.
Periodic boundary conditions were used and the lattice was repeated periodically.
We implemented the Ewald summation technique for the calculation of the longrange dipolar interactions so the values of the dipolar interaction tensor (D ij ) were
the same used in the Ewald matrix.
2.2.3.2 Results and Discussion
The MC simulations of the ZFC/FC susceptibility curves are reported in Fig. 2.11a.
Notably, they quite well reproduce the observed SSG-type behavior of the Co/Mn film
[32]. Simulations were also performed removing from the Hamiltonian the interface
Co/Mn coupling energy term (j CoMn = j’ CoMn = 0; Fig. 2.11b) in order to check
the role of the exchange coupling at the core/shell interface. In this case, the SSG
behavior is not produced.
In Fig. 2.12a, the hysteresis loop of the MC simulations without field cooling
and after field cooling (H cooling = 0.4) procedure are reported. In our Hamiltonian, in
order to take into account the non-uniform alloying, we have introduced two different
j CoMn values (j CoMn = 0.3; j
CoMn = 1.0). In Fig. 2.12b, we show the results for our
system with uniform alloying by setting (j CoMn = j
CoMn = 0.3 along the interface.
Notably, the comparison between the two simulation results shows that the disorder
due to the alloying enhances the exchange bias field value (from 0.006, in Fig. 2.12b,
to 0.048 in Fig. 2.12a).
Fig. 2.11 Monte Carlo simulation results for Co/Mn system (a) and the system without taking into
account interface effects (j CoMn = j’ CoMn = 0) (b), under an applied field H = 0.1 [32]