

17 Nanocomposites for Permanent Magnets
419
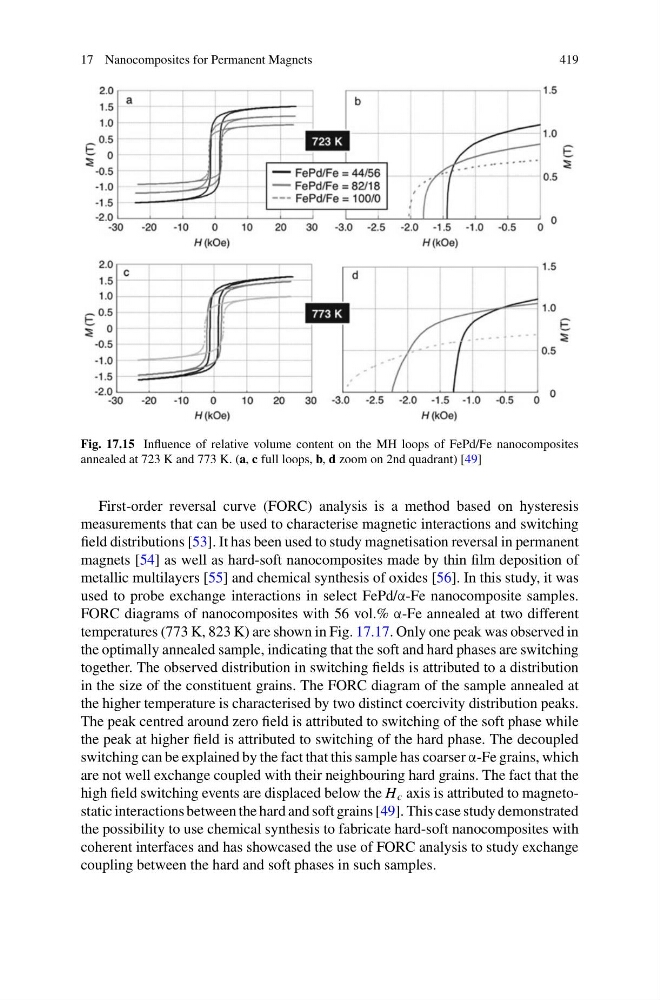
Fig. 17.15 Influence of relative volume content on the MH loops of FePd/Fe nanocomposites
annealed at 723 K and 773 K. (a, c full loops, b, d zoom on 2nd quadrant) [49]
First-order reversal curve (FORC) analysis is a method based on hysteresis
measurements that can be used to characterise magnetic interactions and switching
field distributions [53]. It has been used to study magnetisation reversal in permanent
magnets [54] as well as hard-soft nanocomposites made by thin film deposition of
metallic multilayers [55] and chemical synthesis of oxides [56]. In this study, it was
used to probe exchange interactions in select FePd/α-Fe nanocomposite samples.
FORC diagrams of nanocomposites with 56 vol.% α-Fe annealed at two different
temperatures (773 K, 823 K) are shown in Fig. 17.17. Only one peak was observed in
the optimally annealed sample, indicating that the soft and hard phases are switching
together. The observed distribution in switching fields is attributed to a distribution
in the size of the constituent grains. The FORC diagram of the sample annealed at
the higher temperature is characterised by two distinct coercivity distribution peaks.
The peak centred around zero field is attributed to switching of the soft phase while
the peak at higher field is attributed to switching of the hard phase. The decoupled
switching can be explained by the fact that this sample has coarser α-Fe grains, which
are not well exchange coupled with their neighbouring hard grains. The fact that the
high field switching events are displaced below the H c axis is attributed to magnetostatic interactions between the hard and soft grains [49]. This case study demonstrated
the possibility to use chemical synthesis to fabricate hard-soft nanocomposites with
coherent interfaces and has showcased the use of FORC analysis to study exchange
coupling between the hard and soft phases in such samples.
419
Fig. 17.15 Influence of relative volume content on the MH loops of FePd/Fe nanocomposites
annealed at 723 K and 773 K. (a, c full loops, b, d zoom on 2nd quadrant) [49]
First-order reversal curve (FORC) analysis is a method based on hysteresis
measurements that can be used to characterise magnetic interactions and switching
field distributions [53]. It has been used to study magnetisation reversal in permanent
magnets [54] as well as hard-soft nanocomposites made by thin film deposition of
metallic multilayers [55] and chemical synthesis of oxides [56]. In this study, it was
used to probe exchange interactions in select FePd/α-Fe nanocomposite samples.
FORC diagrams of nanocomposites with 56 vol.% α-Fe annealed at two different
temperatures (773 K, 823 K) are shown in Fig. 17.17. Only one peak was observed in
the optimally annealed sample, indicating that the soft and hard phases are switching
together. The observed distribution in switching fields is attributed to a distribution
in the size of the constituent grains. The FORC diagram of the sample annealed at
the higher temperature is characterised by two distinct coercivity distribution peaks.
The peak centred around zero field is attributed to switching of the soft phase while
the peak at higher field is attributed to switching of the hard phase. The decoupled
switching can be explained by the fact that this sample has coarser α-Fe grains, which
are not well exchange coupled with their neighbouring hard grains. The fact that the
high field switching events are displaced below the H c axis is attributed to magnetostatic interactions between the hard and soft grains [49]. This case study demonstrated
the possibility to use chemical synthesis to fabricate hard-soft nanocomposites with
coherent interfaces and has showcased the use of FORC analysis to study exchange
coupling between the hard and soft phases in such samples.