

418
I. de Moraes and N. M. Dempsey
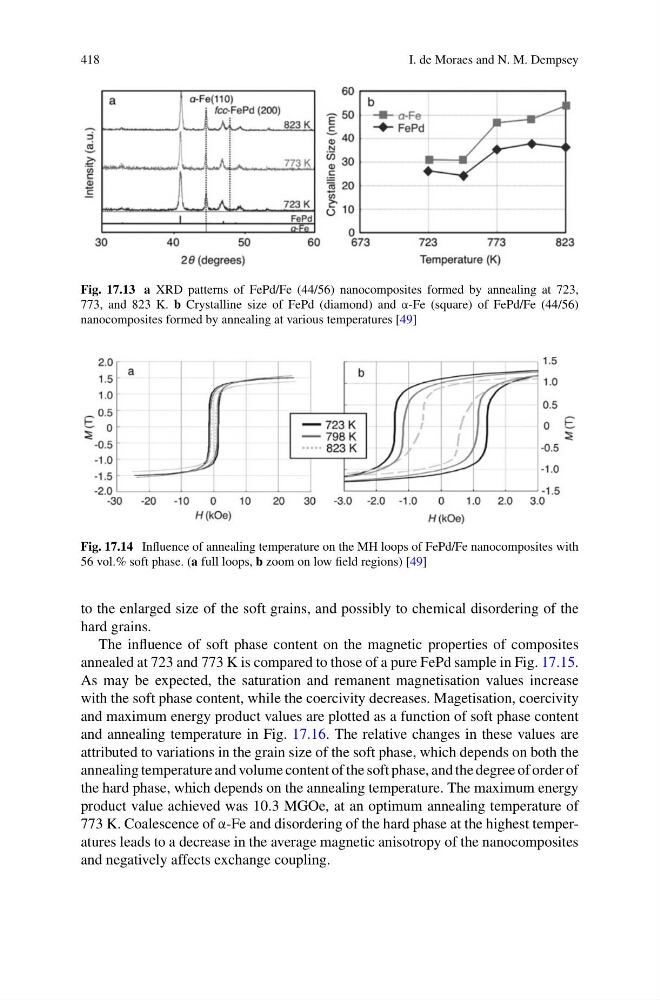
Fig. 17.13 a XRD patterns of FePd/Fe (44/56) nanocomposites formed by annealing at 723,
773, and 823 K. b Crystalline size of FePd (diamond) and α-Fe (square) of FePd/Fe (44/56)
nanocomposites formed by annealing at various temperatures [49]
Fig. 17.14 Influence of annealing temperature on the MH loops of FePd/Fe nanocomposites with
56 vol.% soft phase. (a full loops, b zoom on low field regions) [49]
to the enlarged size of the soft grains, and possibly to chemical disordering of the
hard grains.
The influence of soft phase content on the magnetic properties of composites
annealed at 723 and 773 K is compared to those of a pure FePd sample in Fig. 17.15.
As may be expected, the saturation and remanent magnetisation values increase
with the soft phase content, while the coercivity decreases. Magetisation, coercivity
and maximum energy product values are plotted as a function of soft phase content
and annealing temperature in Fig. 17.16. The relative changes in these values are
attributed to variations in the grain size of the soft phase, which depends on both the
annealing temperature and volume content of the soft phase, and the degree of order of
the hard phase, which depends on the annealing temperature. The maximum energy
product value achieved was 10.3 MGOe, at an optimum annealing temperature of
773 K. Coalescence of α-Fe and disordering of the hard phase at the highest temperatures leads to a decrease in the average magnetic anisotropy of the nanocomposites
and negatively affects exchange coupling.
I. de Moraes and N. M. Dempsey
Fig. 17.13 a XRD patterns of FePd/Fe (44/56) nanocomposites formed by annealing at 723,
773, and 823 K. b Crystalline size of FePd (diamond) and α-Fe (square) of FePd/Fe (44/56)
nanocomposites formed by annealing at various temperatures [49]
Fig. 17.14 Influence of annealing temperature on the MH loops of FePd/Fe nanocomposites with
56 vol.% soft phase. (a full loops, b zoom on low field regions) [49]
to the enlarged size of the soft grains, and possibly to chemical disordering of the
hard grains.
The influence of soft phase content on the magnetic properties of composites
annealed at 723 and 773 K is compared to those of a pure FePd sample in Fig. 17.15.
As may be expected, the saturation and remanent magnetisation values increase
with the soft phase content, while the coercivity decreases. Magetisation, coercivity
and maximum energy product values are plotted as a function of soft phase content
and annealing temperature in Fig. 17.16. The relative changes in these values are
attributed to variations in the grain size of the soft phase, which depends on both the
annealing temperature and volume content of the soft phase, and the degree of order of
the hard phase, which depends on the annealing temperature. The maximum energy
product value achieved was 10.3 MGOe, at an optimum annealing temperature of
773 K. Coalescence of α-Fe and disordering of the hard phase at the highest temperatures leads to a decrease in the average magnetic anisotropy of the nanocomposites
and negatively affects exchange coupling.