

17 Nanocomposites for Permanent Magnets
413
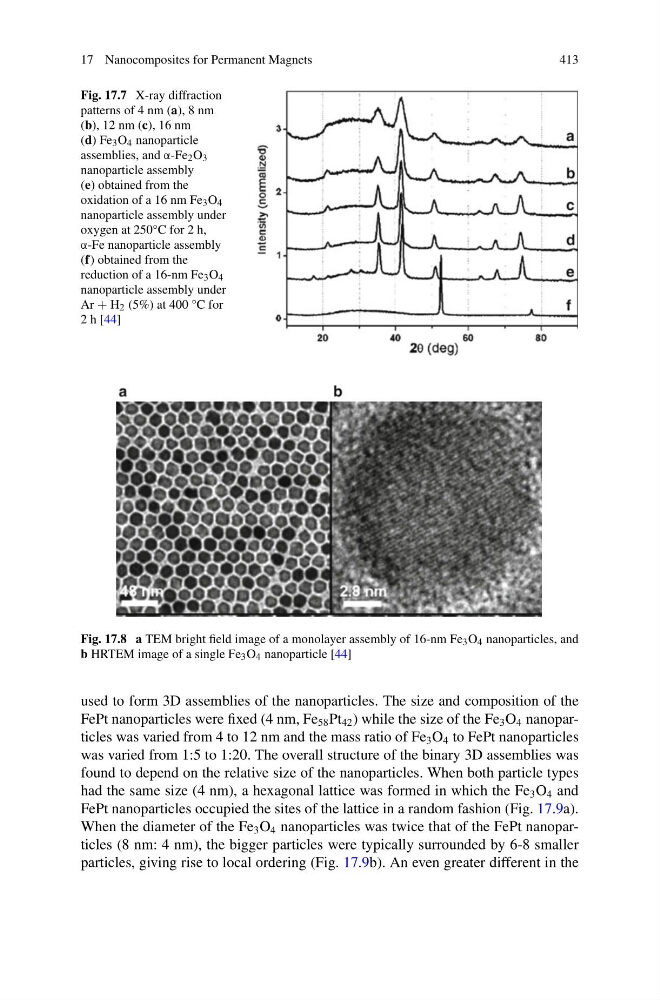
Fig. 17.7 X-ray diffraction
patterns of 4 nm (a), 8 nm
(b), 12 nm (c), 16 nm
(d) Fe 3 O 4 nanoparticle
assemblies, and α-Fe 2 O 3
nanoparticle assembly
(e) obtained from the
oxidation of a 16 nm Fe 3 O 4
nanoparticle assembly under
oxygen at 250°C for 2 h,
α-Fe nanoparticle assembly
(f) obtained from the
reduction of a 16-nm Fe 3 O 4
nanoparticle assembly under
Ar + H 2 (5%) at 400 °C for
2 h [44]
Fig. 17.8 a TEM bright field image of a monolayer assembly of 16-nm Fe 3 O 4 nanoparticles, and
b HRTEM image of a single Fe 3 O 4 nanoparticle [44]
used to form 3D assemblies of the nanoparticles. The size and composition of the
FePt nanoparticles were fixed (4 nm, Fe 58 Pt 42 ) while the size of the Fe 3 O 4 nanoparticles was varied from 4 to 12 nm and the mass ratio of Fe 3 O 4 to FePt nanoparticles
was varied from 1:5 to 1:20. The overall structure of the binary 3D assemblies was
found to depend on the relative size of the nanoparticles. When both particle types
had the same size (4 nm), a hexagonal lattice was formed in which the Fe 3 O 4 and
FePt nanoparticles occupied the sites of the lattice in a random fashion (Fig. 17.9a).
When the diameter of the Fe 3 O 4 nanoparticles was twice that of the FePt nanoparticles (8 nm: 4 nm), the bigger particles were typically surrounded by 6-8 smaller
particles, giving rise to local ordering (Fig. 17.9b). An even greater different in the
413
Fig. 17.7 X-ray diffraction
patterns of 4 nm (a), 8 nm
(b), 12 nm (c), 16 nm
(d) Fe 3 O 4 nanoparticle
assemblies, and α-Fe 2 O 3
nanoparticle assembly
(e) obtained from the
oxidation of a 16 nm Fe 3 O 4
nanoparticle assembly under
oxygen at 250°C for 2 h,
α-Fe nanoparticle assembly
(f) obtained from the
reduction of a 16-nm Fe 3 O 4
nanoparticle assembly under
Ar + H 2 (5%) at 400 °C for
2 h [44]
Fig. 17.8 a TEM bright field image of a monolayer assembly of 16-nm Fe 3 O 4 nanoparticles, and
b HRTEM image of a single Fe 3 O 4 nanoparticle [44]
used to form 3D assemblies of the nanoparticles. The size and composition of the
FePt nanoparticles were fixed (4 nm, Fe 58 Pt 42 ) while the size of the Fe 3 O 4 nanoparticles was varied from 4 to 12 nm and the mass ratio of Fe 3 O 4 to FePt nanoparticles
was varied from 1:5 to 1:20. The overall structure of the binary 3D assemblies was
found to depend on the relative size of the nanoparticles. When both particle types
had the same size (4 nm), a hexagonal lattice was formed in which the Fe 3 O 4 and
FePt nanoparticles occupied the sites of the lattice in a random fashion (Fig. 17.9a).
When the diameter of the Fe 3 O 4 nanoparticles was twice that of the FePt nanoparticles (8 nm: 4 nm), the bigger particles were typically surrounded by 6-8 smaller
particles, giving rise to local ordering (Fig. 17.9b). An even greater different in the