

16 Magnetic Fluids for Thermoelectricity
391
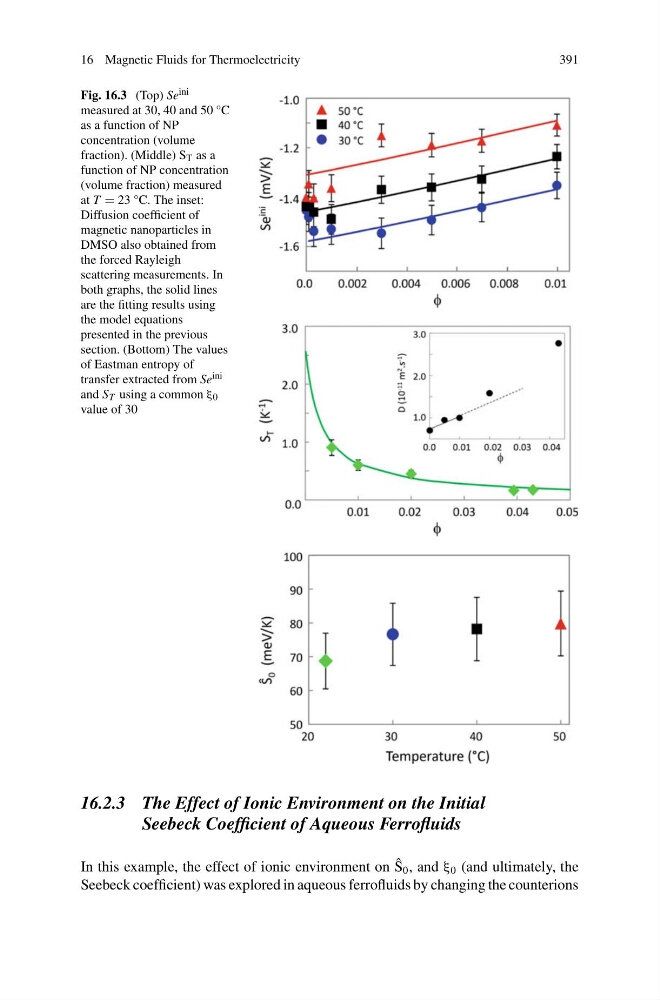
Fig. 16.3 (Top) Se ini
measured at 30, 40 and 50 °C
as a function of NP
concentration (volume
fraction). (Middle) S T as a
function of NP concentration
(volume fraction) measured
at T = 23 °C. The inset:
Diffusion coefficient of
magnetic nanoparticles in
DMSO also obtained from
the forced Rayleigh
scattering measurements. In
both graphs, the solid lines
are the fitting results using
the model equations
presented in the previous
section. (Bottom) The values
of Eastman entropy of
transfer extracted from Se ini
and S T using a common ξ 0
value of 30
16.2.3 The Effect of Ionic Environment on the Initial
Seebeck Coefficient of Aqueous Ferrofluids
In this example, the effect of ionic environment on ˆ
S 0 , and ξ 0 (and ultimately, the
Seebeck coefficient) was explored in aqueous ferrofluids by changing the counterions
391
Fig. 16.3 (Top) Se ini
measured at 30, 40 and 50 °C
as a function of NP
concentration (volume
fraction). (Middle) S T as a
function of NP concentration
(volume fraction) measured
at T = 23 °C. The inset:
Diffusion coefficient of
magnetic nanoparticles in
DMSO also obtained from
the forced Rayleigh
scattering measurements. In
both graphs, the solid lines
are the fitting results using
the model equations
presented in the previous
section. (Bottom) The values
of Eastman entropy of
transfer extracted from Se ini
and S T using a common ξ 0
value of 30
16.2.3 The Effect of Ionic Environment on the Initial
Seebeck Coefficient of Aqueous Ferrofluids
In this example, the effect of ionic environment on ˆ
S 0 , and ξ 0 (and ultimately, the
Seebeck coefficient) was explored in aqueous ferrofluids by changing the counterions