

310
C. Marquina
Tissue sections were also imaged by confocal and fluorescence microscopies.
Despite the fact that the size of the nanoparticles is below the resolution limit of the
light microscope, nanoparticle aggregates were clearly visualized by the differential
interference contrast (DIC) or Nomarski technique on a projection of a 3D confocal
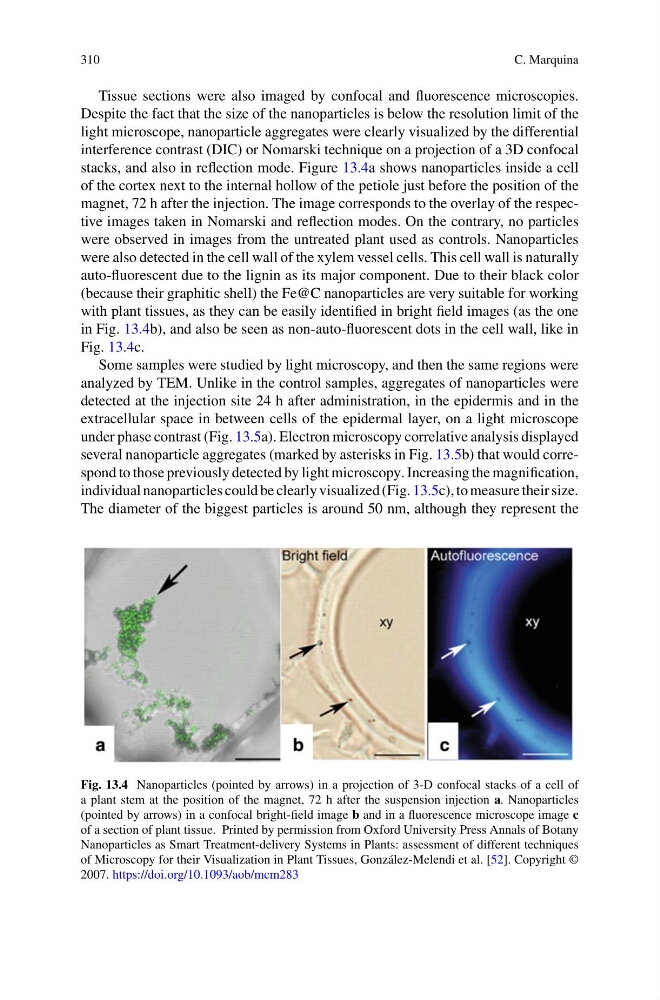
stacks, and also in reflection mode. Figure 13.4a shows nanoparticles inside a cell
of the cortex next to the internal hollow of the petiole just before the position of the
magnet, 72 h after the injection. The image corresponds to the overlay of the respective images taken in Nomarski and reflection modes. On the contrary, no particles
were observed in images from the untreated plant used as controls. Nanoparticles
were also detected in the cell wall of the xylem vessel cells. This cell wall is naturally
auto-fluorescent due to the lignin as its major component. Due to their black color
(because their graphitic shell) the Fe@C nanoparticles are very suitable for working
with plant tissues, as they can be easily identified in bright field images (as the one
in Fig. 13.4b), and also be seen as non-auto-fluorescent dots in the cell wall, like in
Fig. 13.4c.
Some samples were studied by light microscopy, and then the same regions were
analyzed by TEM. Unlike in the control samples, aggregates of nanoparticles were
detected at the injection site 24 h after administration, in the epidermis and in the
extracellular space in between cells of the epidermal layer, on a light microscope
under phase contrast (Fig. 13.5a). Electron microscopy correlative analysis displayed
several nanoparticle aggregates (marked by asterisks in Fig. 13.5b) that would correspond to those previously detected by light microscopy. Increasing the magnification,
individual nanoparticles could be clearly visualized (Fig. 13.5c), to measure their size.
The diameter of the biggest particles is around 50 nm, although they represent the
Fig. 13.4 Nanoparticles (pointed by arrows) in a projection of 3-D confocal stacks of a cell of
a plant stem at the position of the magnet, 72 h after the suspension injection a. Nanoparticles
(pointed by arrows) in a confocal bright-field image b and in a fluorescence microscope image c
of a section of plant tissue. Printed by permission from Oxford University Press Annals of Botany
Nanoparticles as Smart Treatment-delivery Systems in Plants: assessment of different techniques
of Microscopy for their Visualization in Plant Tissues, González-Melendi et al. [52]. Copyright ©
2007. https://doi.org/10.1093/aob/mcm283
C. Marquina
Tissue sections were also imaged by confocal and fluorescence microscopies.
Despite the fact that the size of the nanoparticles is below the resolution limit of the
light microscope, nanoparticle aggregates were clearly visualized by the differential
interference contrast (DIC) or Nomarski technique on a projection of a 3D confocal
stacks, and also in reflection mode. Figure 13.4a shows nanoparticles inside a cell
of the cortex next to the internal hollow of the petiole just before the position of the
magnet, 72 h after the injection. The image corresponds to the overlay of the respective images taken in Nomarski and reflection modes. On the contrary, no particles
were observed in images from the untreated plant used as controls. Nanoparticles
were also detected in the cell wall of the xylem vessel cells. This cell wall is naturally
auto-fluorescent due to the lignin as its major component. Due to their black color
(because their graphitic shell) the Fe@C nanoparticles are very suitable for working
with plant tissues, as they can be easily identified in bright field images (as the one
in Fig. 13.4b), and also be seen as non-auto-fluorescent dots in the cell wall, like in
Fig. 13.4c.
Some samples were studied by light microscopy, and then the same regions were
analyzed by TEM. Unlike in the control samples, aggregates of nanoparticles were
detected at the injection site 24 h after administration, in the epidermis and in the
extracellular space in between cells of the epidermal layer, on a light microscope
under phase contrast (Fig. 13.5a). Electron microscopy correlative analysis displayed
several nanoparticle aggregates (marked by asterisks in Fig. 13.5b) that would correspond to those previously detected by light microscopy. Increasing the magnification,
individual nanoparticles could be clearly visualized (Fig. 13.5c), to measure their size.
The diameter of the biggest particles is around 50 nm, although they represent the
Fig. 13.4 Nanoparticles (pointed by arrows) in a projection of 3-D confocal stacks of a cell of
a plant stem at the position of the magnet, 72 h after the suspension injection a. Nanoparticles
(pointed by arrows) in a confocal bright-field image b and in a fluorescence microscope image c
of a section of plant tissue. Printed by permission from Oxford University Press Annals of Botany
Nanoparticles as Smart Treatment-delivery Systems in Plants: assessment of different techniques
of Microscopy for their Visualization in Plant Tissues, González-Melendi et al. [52]. Copyright ©
2007. https://doi.org/10.1093/aob/mcm283