

11 Electron Tomography
275
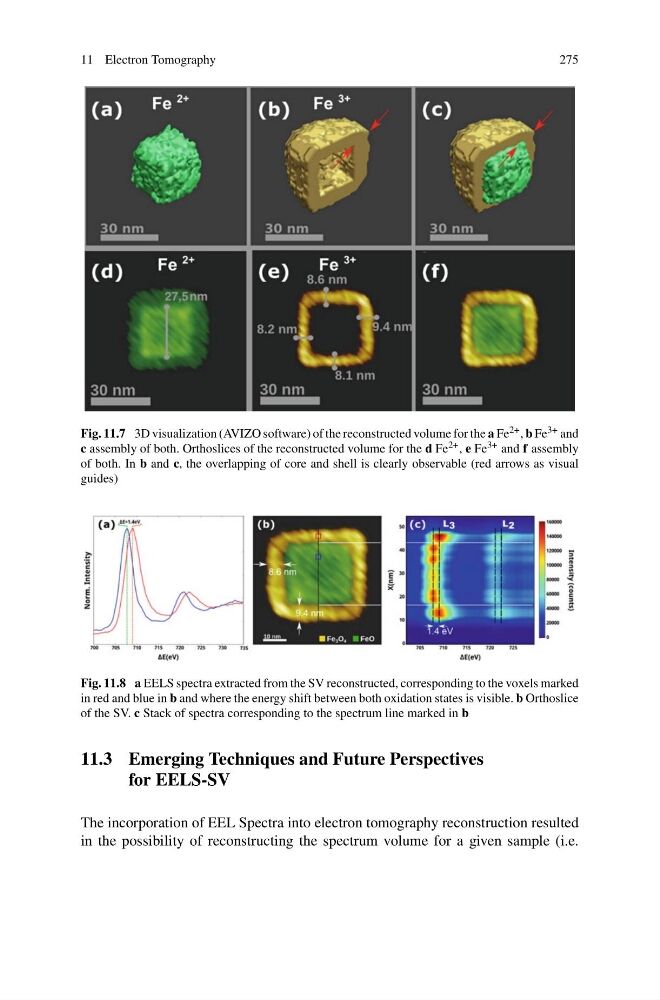
Fig. 11.7 3D visualization (AVIZO software) of the reconstructed volume for the a Fe 2+ , b Fe 3+ and
c assembly of both. Orthoslices of the reconstructed volume for the d Fe 2+ , e Fe 3+ and f assembly
of both. In b and c, the overlapping of core and shell is clearly observable (red arrows as visual
guides)
Fig. 11.8 a EELS spectra extracted from the SV reconstructed, corresponding to the voxels marked
in red and blue in b and where the energy shift between both oxidation states is visible. b Orthoslice
of the SV. c Stack of spectra corresponding to the spectrum line marked in b
11.3 Emerging Techniques and Future Perspectives
for EELS-SV
The incorporation of EEL Spectra into electron tomography reconstruction resulted
in the possibility of reconstructing the spectrum volume for a given sample (i.e.
275
Fig. 11.7 3D visualization (AVIZO software) of the reconstructed volume for the a Fe 2+ , b Fe 3+ and
c assembly of both. Orthoslices of the reconstructed volume for the d Fe 2+ , e Fe 3+ and f assembly
of both. In b and c, the overlapping of core and shell is clearly observable (red arrows as visual
guides)
Fig. 11.8 a EELS spectra extracted from the SV reconstructed, corresponding to the voxels marked
in red and blue in b and where the energy shift between both oxidation states is visible. b Orthoslice
of the SV. c Stack of spectra corresponding to the spectrum line marked in b
11.3 Emerging Techniques and Future Perspectives
for EELS-SV
The incorporation of EEL Spectra into electron tomography reconstruction resulted
in the possibility of reconstructing the spectrum volume for a given sample (i.e.