

274
P. Torruella et al.
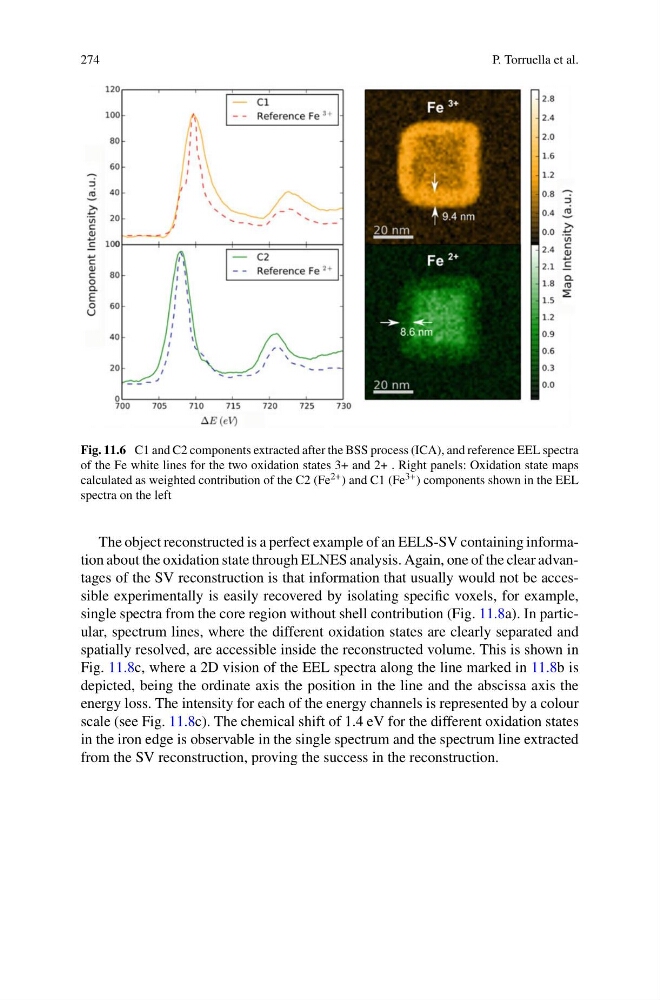
Fig. 11.6 C1 and C2 components extracted after the BSS process (ICA), and reference EEL spectra
of the Fe white lines for the two oxidation states 3+ and 2+ . Right panels: Oxidation state maps
calculated as weighted contribution of the C2 (Fe 2+ ) and C1 (Fe 3+ ) components shown in the EEL
spectra on the left
The object reconstructed is a perfect example of an EELS-SV containing information about the oxidation state through ELNES analysis. Again, one of the clear advantages of the SV reconstruction is that information that usually would not be accessible experimentally is easily recovered by isolating specific voxels, for example,
single spectra from the core region without shell contribution (Fig. 11.8a). In particular, spectrum lines, where the different oxidation states are clearly separated and
spatially resolved, are accessible inside the reconstructed volume. This is shown in
Fig. 11.8c, where a 2D vision of the EEL spectra along the line marked in 11.8b is
depicted, being the ordinate axis the position in the line and the abscissa axis the
energy loss. The intensity for each of the energy channels is represented by a colour
scale (see Fig. 11.8c). The chemical shift of 1.4 eV for the different oxidation states
in the iron edge is observable in the single spectrum and the spectrum line extracted
from the SV reconstruction, proving the success in the reconstruction.
P. Torruella et al.
Fig. 11.6 C1 and C2 components extracted after the BSS process (ICA), and reference EEL spectra
of the Fe white lines for the two oxidation states 3+ and 2+ . Right panels: Oxidation state maps
calculated as weighted contribution of the C2 (Fe 2+ ) and C1 (Fe 3+ ) components shown in the EEL
spectra on the left
The object reconstructed is a perfect example of an EELS-SV containing information about the oxidation state through ELNES analysis. Again, one of the clear advantages of the SV reconstruction is that information that usually would not be accessible experimentally is easily recovered by isolating specific voxels, for example,
single spectra from the core region without shell contribution (Fig. 11.8a). In particular, spectrum lines, where the different oxidation states are clearly separated and
spatially resolved, are accessible inside the reconstructed volume. This is shown in
Fig. 11.8c, where a 2D vision of the EEL spectra along the line marked in 11.8b is
depicted, being the ordinate axis the position in the line and the abscissa axis the
energy loss. The intensity for each of the energy channels is represented by a colour
scale (see Fig. 11.8c). The chemical shift of 1.4 eV for the different oxidation states
in the iron edge is observable in the single spectrum and the spectrum line extracted
from the SV reconstruction, proving the success in the reconstruction.