

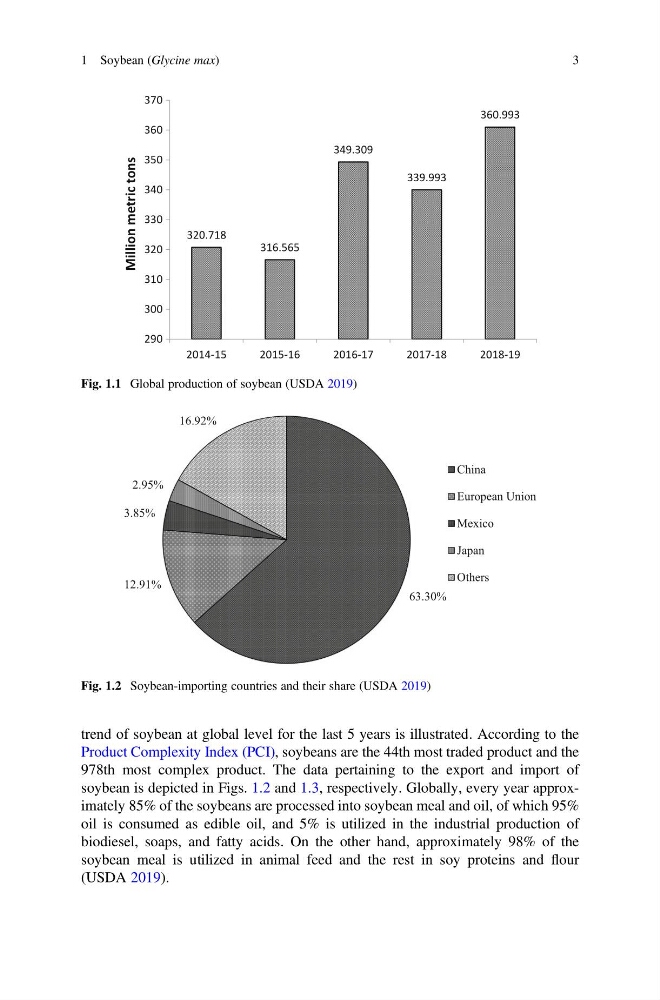
trend of soybean at global level for the last 5 years is illustrated. According to the
Product Complexity Index (PCI), soybeans are the 44th most traded product and the
978th most complex product. The data pertaining to the export and import of
soybean is depicted in Figs. 1.2 and 1.3, respectively. Globally, every year approximately 85% of the soybeans are processed into soybean meal and oil, of which 95%
oil is consumed as edible oil, and 5% is utilized in the industrial production of
biodiesel, soaps, and fatty acids. On the other hand, approximately 98% of the
soybean meal is utilized in animal feed and the rest in soy proteins and flour
(USDA 2019).
320.718
316.565
349.309
339.993
360.993
290
300
310
320
330
340
350
360
370
2014-15
2015-16
2016-17
2017-18
2018-19
s
n
o
t
c
i
r
t
e
m
n
o
i
l
l
i
M
Fig. 1.1 Global production of soybean (USDA 2019)
63.30%
12.91%
3.85%
2.95%
16.92%
China
European Union
Mexico
Japan
Others
Fig. 1.2 Soybean-importing countries and their share (USDA 2019)
1 Soybean (Glycine max)
3
Product Complexity Index (PCI), soybeans are the 44th most traded product and the
978th most complex product. The data pertaining to the export and import of
soybean is depicted in Figs. 1.2 and 1.3, respectively. Globally, every year approximately 85% of the soybeans are processed into soybean meal and oil, of which 95%
oil is consumed as edible oil, and 5% is utilized in the industrial production of
biodiesel, soaps, and fatty acids. On the other hand, approximately 98% of the
soybean meal is utilized in animal feed and the rest in soy proteins and flour
(USDA 2019).
320.718
316.565
349.309
339.993
360.993
290
300
310
320
330
340
350
360
370
2014-15
2015-16
2016-17
2017-18
2018-19
s
n
o
t
c
i
r
t
e
m
n
o
i
l
l
i
M
Fig. 1.1 Global production of soybean (USDA 2019)
63.30%
12.91%
3.85%
2.95%
16.92%
China
European Union
Mexico
Japan
Others
Fig. 1.2 Soybean-importing countries and their share (USDA 2019)
1 Soybean (Glycine max)
3