

1.1 Origin and History
The cultivation of soybeans (Glycine max) was started some 4000–5000 years ago,
with its origin being traced back to China (Qiu and Chang 2010), Japan, and Korea.
Kwon et al. (2005) reported occurrence of carbonized soybeans at some historic sites
in Korean Peninsula, thus providing a strong evidence for its cultivation from the
Bronze Age. Engelbert Kaempfer, a German botanist, has been credited with the
introduction of soybean to Europe in the eighteenth century, but poor climatic and
soil conditions limited its production in the continent. Soybean cultivation began in
the United States only in the nineteenth century and has been a significant commercial crop since then. Apart from the US Food and Drug Administration (FDA)
approving the health claims which linked soybean to reduction in the coronary
heart diseases in 1999, the availability of transgenic soybean, the existence of
regulatory biosafety frameworks, and the incorporation of new land and innovative
agricultural technologies by farmers provided the impetus to the popularization of
soybean in the United States and world at large (Qiu and Chang 2010).
1.2 Production
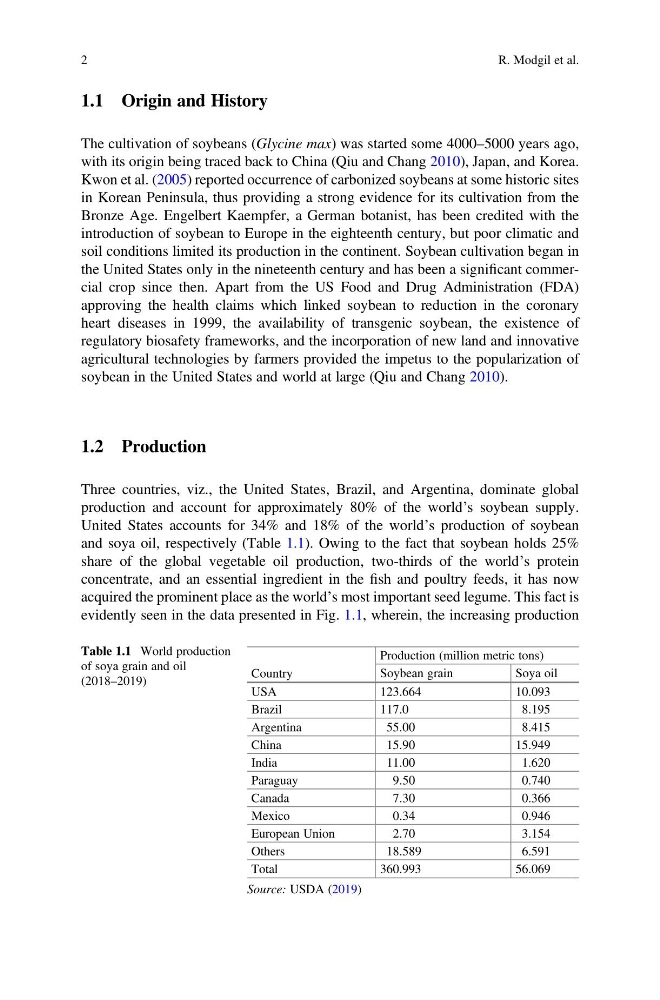
Three countries, viz., the United States, Brazil, and Argentina, dominate global
production and account for approximately 80% of the world’s soybean supply.
United States accounts for 34% and 18% of the world’s production of soybean
and soya oil, respectively (Table 1.1). Owing to the fact that soybean holds 25%
share of the global vegetable oil production, two-thirds of the world’s protein
concentrate, and an essential ingredient in the fish and poultry feeds, it has now
acquired the prominent place as the world’s most important seed legume. This fact is
evidently seen in the data presented in Fig. 1.1, wherein, the increasing production
Table 1.1 World production
of soya grain and oil
(2018–2019)
Country
Production (million metric tons)
Soybean grain
Soya oil
USA
123.664
10.093
Brazil
117.0
8.195
Argentina
55.00
8.415
China
15.90
15.949
India
11.00
1.620
Paraguay
9.50
0.740
Canada
7.30
0.366
Mexico
0.34
0.946
European Union
2.70
3.154
Others
18.589
6.591
Total
360.993
56.069
Source: USDA (2019)
2
R. Modgil et al.
The cultivation of soybeans (Glycine max) was started some 4000–5000 years ago,
with its origin being traced back to China (Qiu and Chang 2010), Japan, and Korea.
Kwon et al. (2005) reported occurrence of carbonized soybeans at some historic sites
in Korean Peninsula, thus providing a strong evidence for its cultivation from the
Bronze Age. Engelbert Kaempfer, a German botanist, has been credited with the
introduction of soybean to Europe in the eighteenth century, but poor climatic and
soil conditions limited its production in the continent. Soybean cultivation began in
the United States only in the nineteenth century and has been a significant commercial crop since then. Apart from the US Food and Drug Administration (FDA)
approving the health claims which linked soybean to reduction in the coronary
heart diseases in 1999, the availability of transgenic soybean, the existence of
regulatory biosafety frameworks, and the incorporation of new land and innovative
agricultural technologies by farmers provided the impetus to the popularization of
soybean in the United States and world at large (Qiu and Chang 2010).
1.2 Production
Three countries, viz., the United States, Brazil, and Argentina, dominate global
production and account for approximately 80% of the world’s soybean supply.
United States accounts for 34% and 18% of the world’s production of soybean
and soya oil, respectively (Table 1.1). Owing to the fact that soybean holds 25%
share of the global vegetable oil production, two-thirds of the world’s protein
concentrate, and an essential ingredient in the fish and poultry feeds, it has now
acquired the prominent place as the world’s most important seed legume. This fact is
evidently seen in the data presented in Fig. 1.1, wherein, the increasing production
Table 1.1 World production
of soya grain and oil
(2018–2019)
Country
Production (million metric tons)
Soybean grain
Soya oil
USA
123.664
10.093
Brazil
117.0
8.195
Argentina
55.00
8.415
China
15.90
15.949
India
11.00
1.620
Paraguay
9.50
0.740
Canada
7.30
0.366
Mexico
0.34
0.946
European Union
2.70
3.154
Others
18.589
6.591
Total
360.993
56.069
Source: USDA (2019)
2
R. Modgil et al.