

3.4 The Fallacies of Household and Rural Electrification
91
25.8
1.6
2.1
3.9
14
51.3
0.1
0.5
0.3
0.5
Fire-wood
Crop residue
Cowdung cake
Coal,Lignite,Charcoal
Kerosene
LPG/PNG
Electricity
Biogas
Any other
No cooking
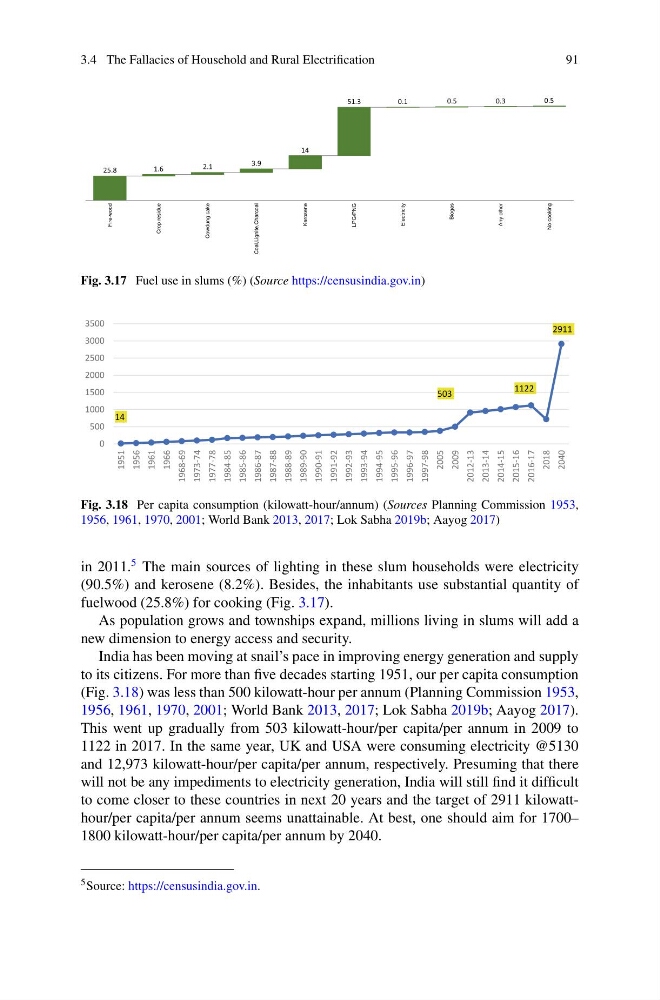
Fig. 3.17 Fuel use in slums (%) (Source https://censusindia.gov.in)
14
503
1122
2911
0
500
1000
1500
2000
2500
3000
3500
1951
1956
1961
1966
1968-69
1973-74
1977-78
1984-85
1985-86
1986-87
1987-88
1988-89
1989-90
1990-91
1991-92
1992-93
1993-94
1994-95
1995-96
1996-97
1997-98
2005
2009
2012-13
2013-14
2014-15
2015-16
2016-17
2018
2040
Fig. 3.18 Per capita consumption (kilowatt-hour/annum) (Sources Planning Commission 1953,
1956, 1961, 1970, 2001; World Bank 2013, 2017; Lok Sabha 2019b; Aayog 2017)
in 2011.
5 The main sources of lighting in these slum households were electricity
(90.5%) and kerosene (8.2%). Besides, the inhabitants use substantial quantity of
fuelwood (25.8%) for cooking (Fig. 3.17).
As population grows and townships expand, millions living in slums will add a
new dimension to energy access and security.
India has been moving at snail’s pace in improving energy generation and supply
to its citizens. For more than five decades starting 1951, our per capita consumption
(Fig. 3.18) was less than 500 kilowatt-hour per annum (Planning Commission 1953,
1956, 1961, 1970, 2001; World Bank 2013, 2017; Lok Sabha 2019b; Aayog 2017).
This went up gradually from 503 kilowatt-hour/per capita/per annum in 2009 to
1122 in 2017. In the same year, UK and USA were consuming electricity @5130
and 12,973 kilowatt-hour/per capita/per annum, respectively. Presuming that there
will not be any impediments to electricity generation, India will still find it difficult
to come closer to these countries in next 20 years and the target of 2911 kilowatthour/per capita/per annum seems unattainable. At best, one should aim for 1700–
1800 kilowatt-hour/per capita/per annum by 2040.
5 Source: https://censusindia.gov.in.
91
25.8
1.6
2.1
3.9
14
51.3
0.1
0.5
0.3
0.5
Fire-wood
Crop residue
Cowdung cake
Coal,Lignite,Charcoal
Kerosene
LPG/PNG
Electricity
Biogas
Any other
No cooking
Fig. 3.17 Fuel use in slums (%) (Source https://censusindia.gov.in)
14
503
1122
2911
0
500
1000
1500
2000
2500
3000
3500
1951
1956
1961
1966
1968-69
1973-74
1977-78
1984-85
1985-86
1986-87
1987-88
1988-89
1989-90
1990-91
1991-92
1992-93
1993-94
1994-95
1995-96
1996-97
1997-98
2005
2009
2012-13
2013-14
2014-15
2015-16
2016-17
2018
2040
Fig. 3.18 Per capita consumption (kilowatt-hour/annum) (Sources Planning Commission 1953,
1956, 1961, 1970, 2001; World Bank 2013, 2017; Lok Sabha 2019b; Aayog 2017)
in 2011.
5 The main sources of lighting in these slum households were electricity
(90.5%) and kerosene (8.2%). Besides, the inhabitants use substantial quantity of
fuelwood (25.8%) for cooking (Fig. 3.17).
As population grows and townships expand, millions living in slums will add a
new dimension to energy access and security.
India has been moving at snail’s pace in improving energy generation and supply
to its citizens. For more than five decades starting 1951, our per capita consumption
(Fig. 3.18) was less than 500 kilowatt-hour per annum (Planning Commission 1953,
1956, 1961, 1970, 2001; World Bank 2013, 2017; Lok Sabha 2019b; Aayog 2017).
This went up gradually from 503 kilowatt-hour/per capita/per annum in 2009 to
1122 in 2017. In the same year, UK and USA were consuming electricity @5130
and 12,973 kilowatt-hour/per capita/per annum, respectively. Presuming that there
will not be any impediments to electricity generation, India will still find it difficult
to come closer to these countries in next 20 years and the target of 2911 kilowatthour/per capita/per annum seems unattainable. At best, one should aim for 1700–
1800 kilowatt-hour/per capita/per annum by 2040.
5 Source: https://censusindia.gov.in.