

72
2 Energy Sector Progression in India
0.00
200.00
400.00
600.00
800.00
1000.00
Coal
Lignite
Crude Oil
Natural Gas
Hydro Power
Nuclear Power
Renewable Energy
Non-commercial Energy
2000–01 (Actual)
2006–07 (Actual)
2011–12 (Provisional)
2021–22 (Projected)
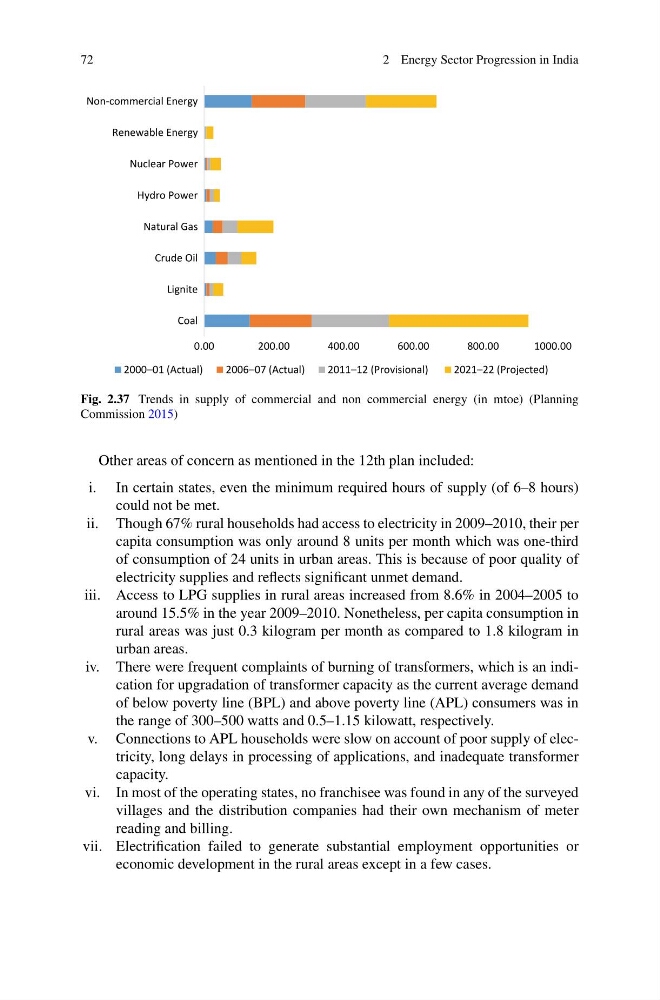
Fig. 2.37 Trends in supply of commercial and non commercial energy (in mtoe) (Planning
Commission 2015)
Other areas of concern as mentioned in the 12th plan included:
i. In certain states, even the minimum required hours of supply (of 6–8 hours)
could not be met.
ii. Though 67% rural households had access to electricity in 2009–2010, their per
capita consumption was only around 8 units per month which was one-third
of consumption of 24 units in urban areas. This is because of poor quality of
electricity supplies and reflects significant unmet demand.
iii. Access to LPG supplies in rural areas increased from 8.6% in 2004–2005 to
around 15.5% in the year 2009–2010. Nonetheless, per capita consumption in
rural areas was just 0.3 kilogram per month as compared to 1.8 kilogram in
urban areas.
iv. There were frequent complaints of burning of transformers, which is an indication for upgradation of transformer capacity as the current average demand
of below poverty line (BPL) and above poverty line (APL) consumers was in
the range of 300–500 watts and 0.5–1.15 kilowatt, respectively.
v. Connections to APL households were slow on account of poor supply of electricity, long delays in processing of applications, and inadequate transformer
capacity.
vi. In most of the operating states, no franchisee was found in any of the surveyed
villages and the distribution companies had their own mechanism of meter
reading and billing.
vii. Electrification failed to generate substantial employment opportunities or
economic development in the rural areas except in a few cases.
2 Energy Sector Progression in India
0.00
200.00
400.00
600.00
800.00
1000.00
Coal
Lignite
Crude Oil
Natural Gas
Hydro Power
Nuclear Power
Renewable Energy
Non-commercial Energy
2000–01 (Actual)
2006–07 (Actual)
2011–12 (Provisional)
2021–22 (Projected)
Fig. 2.37 Trends in supply of commercial and non commercial energy (in mtoe) (Planning
Commission 2015)
Other areas of concern as mentioned in the 12th plan included:
i. In certain states, even the minimum required hours of supply (of 6–8 hours)
could not be met.
ii. Though 67% rural households had access to electricity in 2009–2010, their per
capita consumption was only around 8 units per month which was one-third
of consumption of 24 units in urban areas. This is because of poor quality of
electricity supplies and reflects significant unmet demand.
iii. Access to LPG supplies in rural areas increased from 8.6% in 2004–2005 to
around 15.5% in the year 2009–2010. Nonetheless, per capita consumption in
rural areas was just 0.3 kilogram per month as compared to 1.8 kilogram in
urban areas.
iv. There were frequent complaints of burning of transformers, which is an indication for upgradation of transformer capacity as the current average demand
of below poverty line (BPL) and above poverty line (APL) consumers was in
the range of 300–500 watts and 0.5–1.15 kilowatt, respectively.
v. Connections to APL households were slow on account of poor supply of electricity, long delays in processing of applications, and inadequate transformer
capacity.
vi. In most of the operating states, no franchisee was found in any of the surveyed
villages and the distribution companies had their own mechanism of meter
reading and billing.
vii. Electrification failed to generate substantial employment opportunities or
economic development in the rural areas except in a few cases.