

2.5 The Complexities of Renewable Energy
73
viii. Clean development mechanism for utilization of fly ash, control of sulfur
and nitrogen oxides and mercury in coal-based thermal power plants required
immediate attention for clean and green energy.
ix. High cost of renewable energy (Fig. 2.38) especially solar was a disincentive
for rural areas despite huge potential of generation:
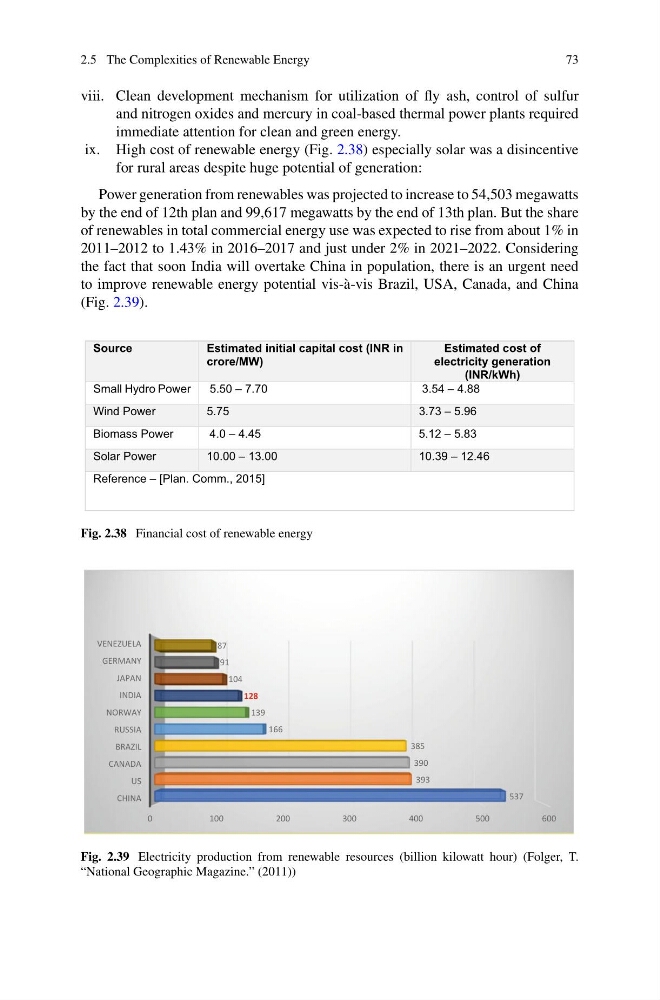
Power generation from renewables was projected to increase to 54,503 megawatts
by the end of 12th plan and 99,617 megawatts by the end of 13th plan. But the share
of renewables in total commercial energy use was expected to rise from about 1% in
2011–2012 to 1.43% in 2016–2017 and just under 2% in 2021–2022. Considering
the fact that soon India will overtake China in population, there is an urgent need
to improve renewable energy potential vis-à-vis Brazil, USA, Canada, and China
(Fig. 2.39).
Source
Estimated initial capital cost (INR in
crore/MW)
Estimated cost of
electricity generation
(INR/kWh)
Small Hydro Power
5.50 — 7.70
3.54 — 4.88
Wind Power
5.75
3.73 — 5.96
Biomass Power
4.0 — 4.45
5.12 — 5.83
Solar Power
10.00 — 13.00
10.39 — 12.46
Reference — [Plan. Comm., 2015]
Fig. 2.38 Financial cost of renewable energy
0
100
200
300
400
500
600
CHINA
US
CANADA
BRAZIL
RUSSIA
NORWAY
INDIA
JAPAN
GERMANY
VENEZUELA
537
393
390
385
166
139
128
104
91
87
Fig. 2.39 Electricity production from renewable resources (billion kilowatt hour) (Folger, T.
“National Geographic Magazine.” (2011))
73
viii. Clean development mechanism for utilization of fly ash, control of sulfur
and nitrogen oxides and mercury in coal-based thermal power plants required
immediate attention for clean and green energy.
ix. High cost of renewable energy (Fig. 2.38) especially solar was a disincentive
for rural areas despite huge potential of generation:
Power generation from renewables was projected to increase to 54,503 megawatts
by the end of 12th plan and 99,617 megawatts by the end of 13th plan. But the share
of renewables in total commercial energy use was expected to rise from about 1% in
2011–2012 to 1.43% in 2016–2017 and just under 2% in 2021–2022. Considering
the fact that soon India will overtake China in population, there is an urgent need
to improve renewable energy potential vis-à-vis Brazil, USA, Canada, and China
(Fig. 2.39).
Source
Estimated initial capital cost (INR in
crore/MW)
Estimated cost of
electricity generation
(INR/kWh)
Small Hydro Power
5.50 — 7.70
3.54 — 4.88
Wind Power
5.75
3.73 — 5.96
Biomass Power
4.0 — 4.45
5.12 — 5.83
Solar Power
10.00 — 13.00
10.39 — 12.46
Reference — [Plan. Comm., 2015]
Fig. 2.38 Financial cost of renewable energy
0
100
200
300
400
500
600
CHINA
US
CANADA
BRAZIL
RUSSIA
NORWAY
INDIA
JAPAN
GERMANY
VENEZUELA
537
393
390
385
166
139
128
104
91
87
Fig. 2.39 Electricity production from renewable resources (billion kilowatt hour) (Folger, T.
“National Geographic Magazine.” (2011))