

2.4 Part III (Emergence of Renewable Sources)
61
(i) The share of non-commercial fuels declined from 74% in 1950–1951 to about
34% in 1996–1997.
(j) In 1996–1997, India imported crude oil and petroleum products worth $9.3
billion (Rs. 31,000 crore).
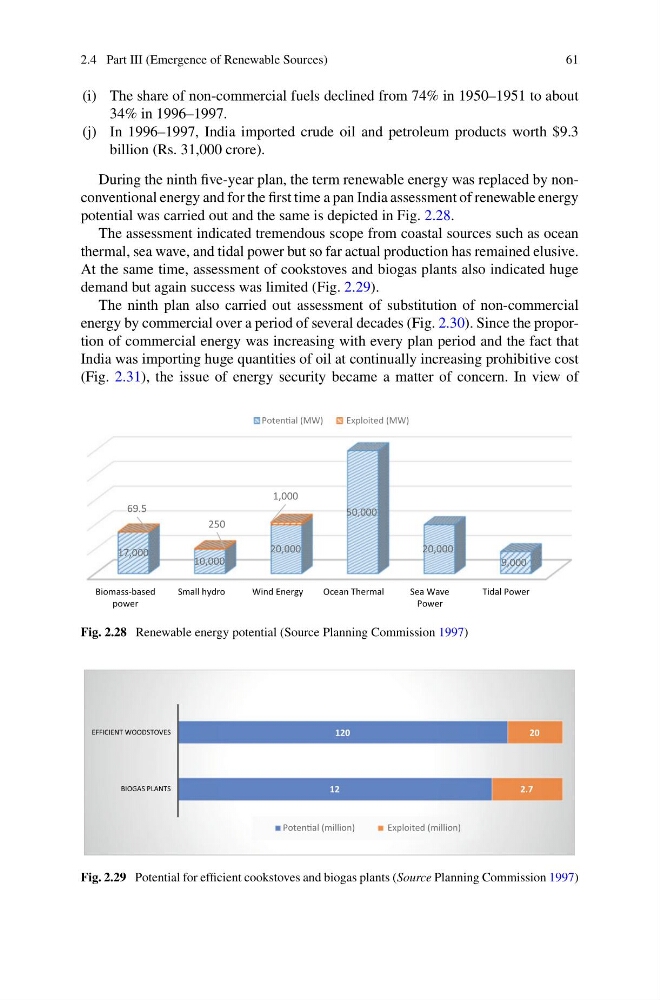
During the ninth five-year plan, the term renewable energy was replaced by nonconventional energy and for the first time a pan India assessment of renewable energy
potential was carried out and the same is depicted in Fig. 2.28.
The assessment indicated tremendous scope from coastal sources such as ocean
thermal, sea wave, and tidal power but so far actual production has remained elusive.
At the same time, assessment of cookstoves and biogas plants also indicated huge
demand but again success was limited (Fig. 2.29).
The ninth plan also carried out assessment of substitution of non-commercial
energy by commercial over a period of several decades (Fig. 2.30). Since the proportion of commercial energy was increasing with every plan period and the fact that
India was importing huge quantities of oil at continually increasing prohibitive cost
(Fig. 2.31), the issue of energy security became a matter of concern. In view of
Biomass-based
power
Small hydro
Wind Energy
Ocean Thermal
Sea Wave
Power
Tidal Power
17,000
10,000
20,000
50,000
20,000
9,000
69.5
250
1,000
PotenƟal (MW)
Exploited (MW)
Fig. 2.28 Renewable energy potential (Source Planning Commission 1997)
12
120
2.7
20
BIOGAS PLANTS
EFFICIENT WOODSTOVES
Poten al (million)
Exploited (million)
Fig. 2.29 Potential for efficient cookstoves and biogas plants (Source Planning Commission 1997)
61
(i) The share of non-commercial fuels declined from 74% in 1950–1951 to about
34% in 1996–1997.
(j) In 1996–1997, India imported crude oil and petroleum products worth $9.3
billion (Rs. 31,000 crore).
During the ninth five-year plan, the term renewable energy was replaced by nonconventional energy and for the first time a pan India assessment of renewable energy
potential was carried out and the same is depicted in Fig. 2.28.
The assessment indicated tremendous scope from coastal sources such as ocean
thermal, sea wave, and tidal power but so far actual production has remained elusive.
At the same time, assessment of cookstoves and biogas plants also indicated huge
demand but again success was limited (Fig. 2.29).
The ninth plan also carried out assessment of substitution of non-commercial
energy by commercial over a period of several decades (Fig. 2.30). Since the proportion of commercial energy was increasing with every plan period and the fact that
India was importing huge quantities of oil at continually increasing prohibitive cost
(Fig. 2.31), the issue of energy security became a matter of concern. In view of
Biomass-based
power
Small hydro
Wind Energy
Ocean Thermal
Sea Wave
Power
Tidal Power
17,000
10,000
20,000
50,000
20,000
9,000
69.5
250
1,000
PotenƟal (MW)
Exploited (MW)
Fig. 2.28 Renewable energy potential (Source Planning Commission 1997)
12
120
2.7
20
BIOGAS PLANTS
EFFICIENT WOODSTOVES
Poten al (million)
Exploited (million)
Fig. 2.29 Potential for efficient cookstoves and biogas plants (Source Planning Commission 1997)