

56
2 Energy Sector Progression in India
States
Installed Capacity (MW)
Andhra Pradesh
3025.43
Assam
569.78
Bihar
1615.27
Gujarat
3396.02
Haryana
1541.21
Himachal Pradesh
270.83
J&K
206.18
Karnataka
2529.8
Kerala
1136.5
M.P.
3033.02
Maharashtra
6196.3
Manipur
10.41
Meghalaya
131.11
Nagaland
4.68
Orissa
1483.12
Punjab
2216.84
Rajasthan
1315.6
Sikkim
15.04
Tamil Nadu
2959
Tripura
19.06
Uttar Pradesh
5311.76
West Bengal
2978.54
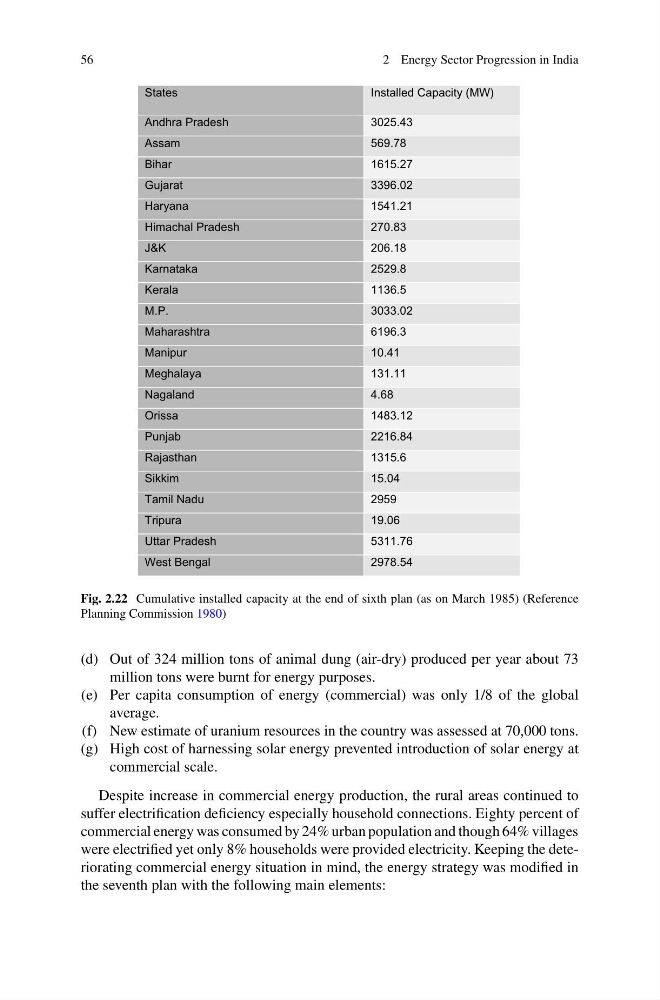
Fig. 2.22 Cumulative installed capacity at the end of sixth plan (as on March 1985) (Reference
Planning Commission 1980)
(d) Out of 324 million tons of animal dung (air-dry) produced per year about 73
million tons were burnt for energy purposes.
(e) Per capita consumption of energy (commercial) was only 1/8 of the global
average.
(f) New estimate of uranium resources in the country was assessed at 70,000 tons.
(g) High cost of harnessing solar energy prevented introduction of solar energy at
commercial scale.
Despite increase in commercial energy production, the rural areas continued to
suffer electrification deficiency especially household connections. Eighty percent of
commercial energy was consumed by 24% urban population and though 64% villages
were electrified yet only 8% households were provided electricity. Keeping the deteriorating commercial energy situation in mind, the energy strategy was modified in
the seventh plan with the following main elements:
2 Energy Sector Progression in India
States
Installed Capacity (MW)
Andhra Pradesh
3025.43
Assam
569.78
Bihar
1615.27
Gujarat
3396.02
Haryana
1541.21
Himachal Pradesh
270.83
J&K
206.18
Karnataka
2529.8
Kerala
1136.5
M.P.
3033.02
Maharashtra
6196.3
Manipur
10.41
Meghalaya
131.11
Nagaland
4.68
Orissa
1483.12
Punjab
2216.84
Rajasthan
1315.6
Sikkim
15.04
Tamil Nadu
2959
Tripura
19.06
Uttar Pradesh
5311.76
West Bengal
2978.54
Fig. 2.22 Cumulative installed capacity at the end of sixth plan (as on March 1985) (Reference
Planning Commission 1980)
(d) Out of 324 million tons of animal dung (air-dry) produced per year about 73
million tons were burnt for energy purposes.
(e) Per capita consumption of energy (commercial) was only 1/8 of the global
average.
(f) New estimate of uranium resources in the country was assessed at 70,000 tons.
(g) High cost of harnessing solar energy prevented introduction of solar energy at
commercial scale.
Despite increase in commercial energy production, the rural areas continued to
suffer electrification deficiency especially household connections. Eighty percent of
commercial energy was consumed by 24% urban population and though 64% villages
were electrified yet only 8% households were provided electricity. Keeping the deteriorating commercial energy situation in mind, the energy strategy was modified in
the seventh plan with the following main elements: