

2.4 Part III (Emergence of Renewable Sources)
57
0
10000
20000
30000
40000
50000
COAL
GAS
DIESEL
THERMAL
NUCLEAR
HYDRO
31-Dec-47 31-Dec-50 31-Mar-56 31-Mar-61 31-Mar-66
31-Mar-74 31-Mar-79 31-Mar-85 31-Mar-90
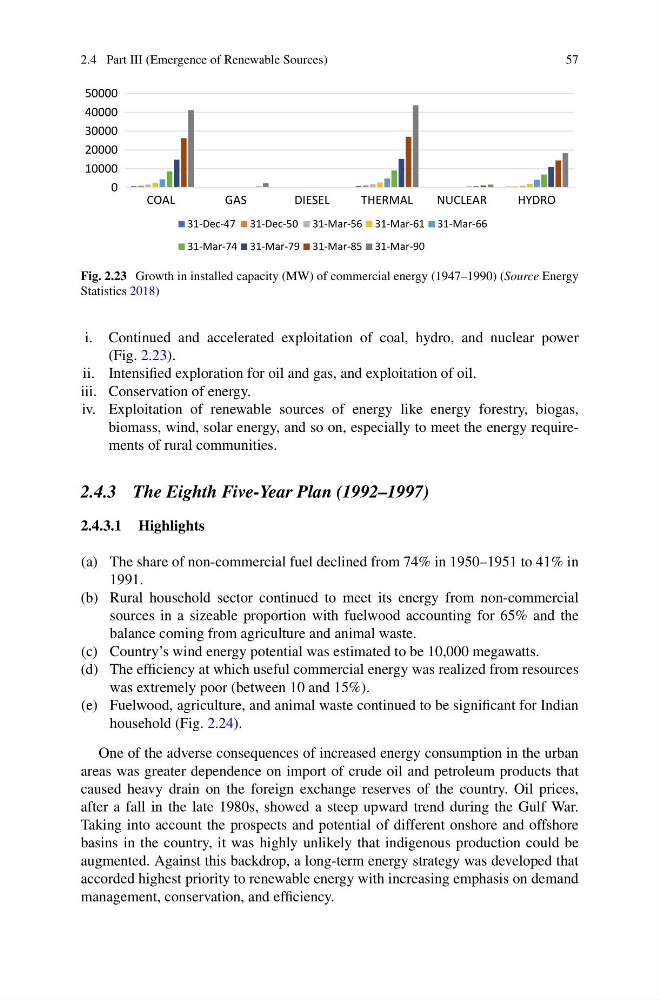
Fig. 2.23 Growth in installed capacity (MW) of commercial energy (1947–1990) (Source Energy
Statistics 2018)
i. Continued and accelerated exploitation of coal, hydro, and nuclear power
(Fig. 2.23).
ii. Intensified exploration for oil and gas, and exploitation of oil.
iii. Conservation of energy.
iv. Exploitation of renewable sources of energy like energy forestry, biogas,
biomass, wind, solar energy, and so on, especially to meet the energy requirements of rural communities.
2.4.3 The Eighth Five-Year Plan (1992–1997)
2.4.3.1 Highlights
(a) The share of non-commercial fuel declined from 74% in 1950–1951 to 41% in
1991.
(b) Rural household sector continued to meet its energy from non-commercial
sources in a sizeable proportion with fuelwood accounting for 65% and the
balance coming from agriculture and animal waste.
(c) Country’s wind energy potential was estimated to be 10,000 megawatts.
(d) The efficiency at which useful commercial energy was realized from resources
was extremely poor (between 10 and 15%).
(e) Fuelwood, agriculture, and animal waste continued to be significant for Indian
household (Fig. 2.24).
One of the adverse consequences of increased energy consumption in the urban
areas was greater dependence on import of crude oil and petroleum products that
caused heavy drain on the foreign exchange reserves of the country. Oil prices,
after a fall in the late 1980s, showed a steep upward trend during the Gulf War.
Taking into account the prospects and potential of different onshore and offshore
basins in the country, it was highly unlikely that indigenous production could be
augmented. Against this backdrop, a long-term energy strategy was developed that
accorded highest priority to renewable energy with increasing emphasis on demand
management, conservation, and efficiency.
57
0
10000
20000
30000
40000
50000
COAL
GAS
DIESEL
THERMAL
NUCLEAR
HYDRO
31-Dec-47 31-Dec-50 31-Mar-56 31-Mar-61 31-Mar-66
31-Mar-74 31-Mar-79 31-Mar-85 31-Mar-90
Fig. 2.23 Growth in installed capacity (MW) of commercial energy (1947–1990) (Source Energy
Statistics 2018)
i. Continued and accelerated exploitation of coal, hydro, and nuclear power
(Fig. 2.23).
ii. Intensified exploration for oil and gas, and exploitation of oil.
iii. Conservation of energy.
iv. Exploitation of renewable sources of energy like energy forestry, biogas,
biomass, wind, solar energy, and so on, especially to meet the energy requirements of rural communities.
2.4.3 The Eighth Five-Year Plan (1992–1997)
2.4.3.1 Highlights
(a) The share of non-commercial fuel declined from 74% in 1950–1951 to 41% in
1991.
(b) Rural household sector continued to meet its energy from non-commercial
sources in a sizeable proportion with fuelwood accounting for 65% and the
balance coming from agriculture and animal waste.
(c) Country’s wind energy potential was estimated to be 10,000 megawatts.
(d) The efficiency at which useful commercial energy was realized from resources
was extremely poor (between 10 and 15%).
(e) Fuelwood, agriculture, and animal waste continued to be significant for Indian
household (Fig. 2.24).
One of the adverse consequences of increased energy consumption in the urban
areas was greater dependence on import of crude oil and petroleum products that
caused heavy drain on the foreign exchange reserves of the country. Oil prices,
after a fall in the late 1980s, showed a steep upward trend during the Gulf War.
Taking into account the prospects and potential of different onshore and offshore
basins in the country, it was highly unlikely that indigenous production could be
augmented. Against this backdrop, a long-term energy strategy was developed that
accorded highest priority to renewable energy with increasing emphasis on demand
management, conservation, and efficiency.