

52
2 Energy Sector Progression in India
28.4
34.7
40.6
46.9
71.6
65.3
59.4
53.1
1953-54
1960-61
1970-71
1980-81
Primary Energy Commercial
Primary Energy Non-Commercial
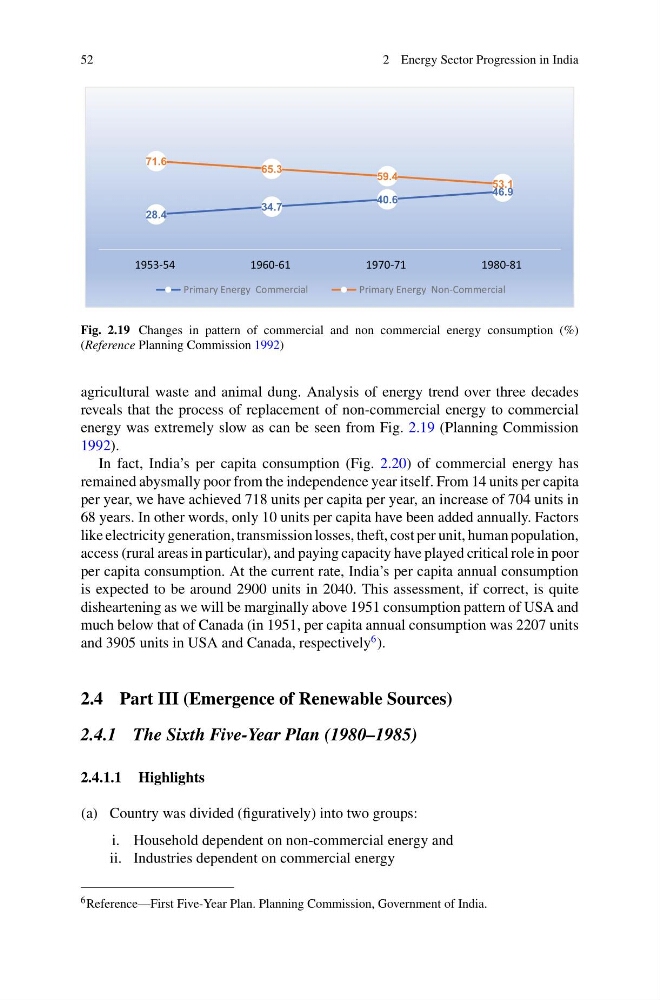
Fig. 2.19 Changes in pattern of commercial and non commercial energy consumption (%)
(Reference Planning Commission 1992)
agricultural waste and animal dung. Analysis of energy trend over three decades
reveals that the process of replacement of non-commercial energy to commercial
energy was extremely slow as can be seen from Fig. 2.19 (Planning Commission
1992).
In fact, India’s per capita consumption (Fig. 2.20) of commercial energy has
remained abysmally poor from the independence year itself. From 14 units per capita
per year, we have achieved 718 units per capita per year, an increase of 704 units in
68 years. In other words, only 10 units per capita have been added annually. Factors
like electricity generation, transmission losses, theft, cost per unit, human population,
access (rural areas in particular), and paying capacity have played critical role in poor
per capita consumption. At the current rate, India’s per capita annual consumption
is expected to be around 2900 units in 2040. This assessment, if correct, is quite
disheartening as we will be marginally above 1951 consumption pattern of USA and
much below that of Canada (in 1951, per capita annual consumption was 2207 units
and 3905 units in USA and Canada, respectively
6 ).
2.4 Part III (Emergence of Renewable Sources)
2.4.1 The Sixth Five-Year Plan (1980–1985)
2.4.1.1 Highlights
(a) Country was divided (figuratively) into two groups:
i. Household dependent on non-commercial energy and
ii. Industries dependent on commercial energy
6 Reference—First Five-Year Plan. Planning Commission, Government of India.
2 Energy Sector Progression in India
28.4
34.7
40.6
46.9
71.6
65.3
59.4
53.1
1953-54
1960-61
1970-71
1980-81
Primary Energy Commercial
Primary Energy Non-Commercial
Fig. 2.19 Changes in pattern of commercial and non commercial energy consumption (%)
(Reference Planning Commission 1992)
agricultural waste and animal dung. Analysis of energy trend over three decades
reveals that the process of replacement of non-commercial energy to commercial
energy was extremely slow as can be seen from Fig. 2.19 (Planning Commission
1992).
In fact, India’s per capita consumption (Fig. 2.20) of commercial energy has
remained abysmally poor from the independence year itself. From 14 units per capita
per year, we have achieved 718 units per capita per year, an increase of 704 units in
68 years. In other words, only 10 units per capita have been added annually. Factors
like electricity generation, transmission losses, theft, cost per unit, human population,
access (rural areas in particular), and paying capacity have played critical role in poor
per capita consumption. At the current rate, India’s per capita annual consumption
is expected to be around 2900 units in 2040. This assessment, if correct, is quite
disheartening as we will be marginally above 1951 consumption pattern of USA and
much below that of Canada (in 1951, per capita annual consumption was 2207 units
and 3905 units in USA and Canada, respectively
6 ).
2.4 Part III (Emergence of Renewable Sources)
2.4.1 The Sixth Five-Year Plan (1980–1985)
2.4.1.1 Highlights
(a) Country was divided (figuratively) into two groups:
i. Household dependent on non-commercial energy and
ii. Industries dependent on commercial energy
6 Reference—First Five-Year Plan. Planning Commission, Government of India.