

2.4 Part III (Emergence of Renewable Sources)
53
YEAR
CONSUMPTION
(KwH)
1951
14
1956
25
1961
38
1966
61.4
1968-69
79
1973-74
97.5
1977-78
120.7
1984-85
168.5
1985-86
178
1986-87
191
1987-88
201
2005
380*
2009
503*
2012-13
914.41
2013-14
956.64
2014-15
1010
2015-16
1075 (765*)
2016-17
1122 (805*)
December 2018
718.3
#
2040 (Anticipated)
2911 — 2924
@
Source — Compiled by author from
1 [Plan. Comm.,1953]; [Plan. Comm.,1956]; [Plan. Comm.,1961]; [Plan.
Comm.,1970].
2 [Plan. Comm. Stat. Profile, 2001].
*3 [World Bank. Little Green Data Book 2017. World Bank 2017].
# 4 [Sabha, Lok. “Lok Sabha Question 337 (Archive)” (2019)]
@ [Aayog, 2017]
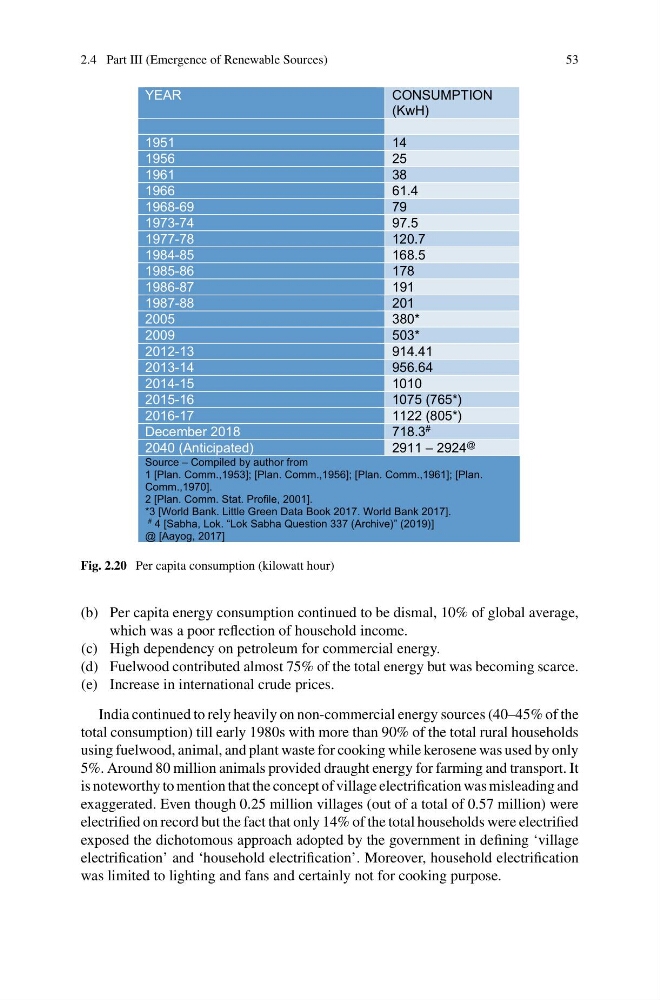
Fig. 2.20 Per capita consumption (kilowatt hour)
(b) Per capita energy consumption continued to be dismal, 10% of global average,
which was a poor reflection of household income.
(c) High dependency on petroleum for commercial energy.
(d) Fuelwood contributed almost 75% of the total energy but was becoming scarce.
(e) Increase in international crude prices.
India continued to rely heavily on non-commercial energy sources (40–45% of the
total consumption) till early 1980s with more than 90% of the total rural households
using fuelwood, animal, and plant waste for cooking while kerosene was used by only
5%. Around 80 million animals provided draught energy for farming and transport. It
is noteworthy to mention that the concept of village electrification was misleading and
exaggerated. Even though 0.25 million villages (out of a total of 0.57 million) were
electrified on record but the fact that only 14% of the total households were electrified
exposed the dichotomous approach adopted by the government in defining ‘village
electrification’ and ‘household electrification’. Moreover, household electrification
was limited to lighting and fans and certainly not for cooking purpose.
53
YEAR
CONSUMPTION
(KwH)
1951
14
1956
25
1961
38
1966
61.4
1968-69
79
1973-74
97.5
1977-78
120.7
1984-85
168.5
1985-86
178
1986-87
191
1987-88
201
2005
380*
2009
503*
2012-13
914.41
2013-14
956.64
2014-15
1010
2015-16
1075 (765*)
2016-17
1122 (805*)
December 2018
718.3
#
2040 (Anticipated)
2911 — 2924
@
Source — Compiled by author from
1 [Plan. Comm.,1953]; [Plan. Comm.,1956]; [Plan. Comm.,1961]; [Plan.
Comm.,1970].
2 [Plan. Comm. Stat. Profile, 2001].
*3 [World Bank. Little Green Data Book 2017. World Bank 2017].
# 4 [Sabha, Lok. “Lok Sabha Question 337 (Archive)” (2019)]
@ [Aayog, 2017]
Fig. 2.20 Per capita consumption (kilowatt hour)
(b) Per capita energy consumption continued to be dismal, 10% of global average,
which was a poor reflection of household income.
(c) High dependency on petroleum for commercial energy.
(d) Fuelwood contributed almost 75% of the total energy but was becoming scarce.
(e) Increase in international crude prices.
India continued to rely heavily on non-commercial energy sources (40–45% of the
total consumption) till early 1980s with more than 90% of the total rural households
using fuelwood, animal, and plant waste for cooking while kerosene was used by only
5%. Around 80 million animals provided draught energy for farming and transport. It
is noteworthy to mention that the concept of village electrification was misleading and
exaggerated. Even though 0.25 million villages (out of a total of 0.57 million) were
electrified on record but the fact that only 14% of the total households were electrified
exposed the dichotomous approach adopted by the government in defining ‘village
electrification’ and ‘household electrification’. Moreover, household electrification
was limited to lighting and fans and certainly not for cooking purpose.