

48
2 Energy Sector Progression in India
Sector 1953-54, 39.9
Sector 1953-54, 43.7
Sector 1953-54, 9.6
Sector 1953-54, 0.5
Sector 1953-54, 1.4
Sector 1953-54, 0.5
Sector 1953-54, 2.9
Sector 1953-54, 1.5
Sector 1960-61, 41.5
Sector 1960-61, 40.2
Sector 1960-61, 9.7
Sector 1960-61, 0.3
Sector 1960-61, 1.6
Sector 1960-61, 0.3
Sector 1960-61, 4.7
Sector 1960-61, 1.7
Industry
Transport
Household
Commercial
Agriculture
Feedstocks
Non-energy use
Others
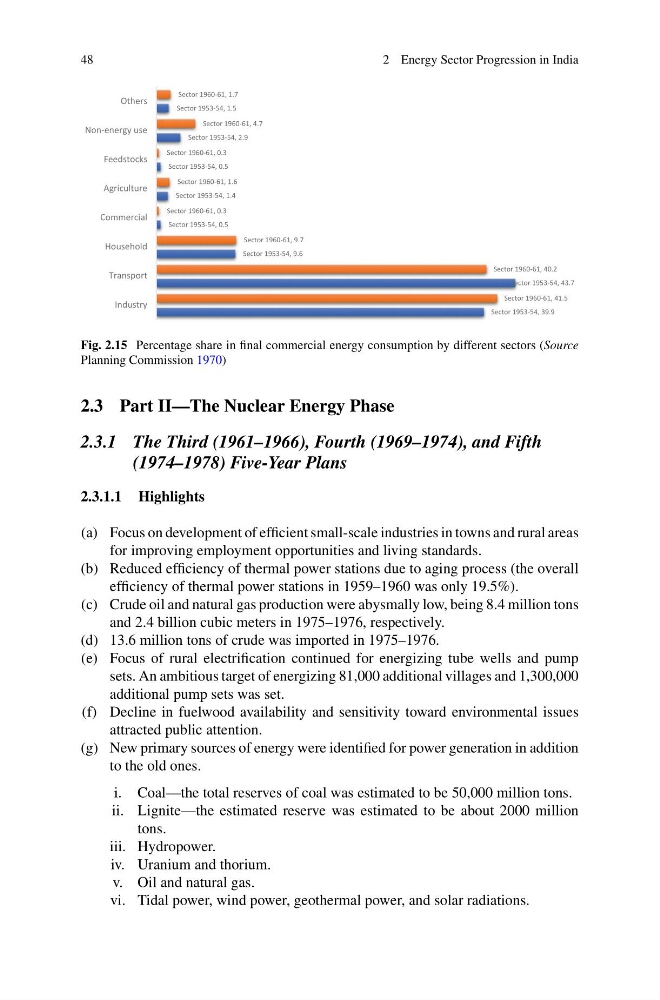
Fig. 2.15 Percentage share in final commercial energy consumption by different sectors (Source
Planning Commission 1970)
2.3 Part II—The Nuclear Energy Phase
2.3.1 The Third (1961–1966), Fourth (1969–1974), and Fifth
(1974–1978) Five-Year Plans
2.3.1.1 Highlights
(a) Focus on development of efficient small-scale industries in towns and rural areas
for improving employment opportunities and living standards.
(b) Reduced efficiency of thermal power stations due to aging process (the overall
efficiency of thermal power stations in 1959–1960 was only 19.5%).
(c) Crude oil and natural gas production were abysmally low, being 8.4 million tons
and 2.4 billion cubic meters in 1975–1976, respectively.
(d) 13.6 million tons of crude was imported in 1975–1976.
(e) Focus of rural electrification continued for energizing tube wells and pump
sets. An ambitious target of energizing 81,000 additional villages and 1,300,000
additional pump sets was set.
(f) Decline in fuelwood availability and sensitivity toward environmental issues
attracted public attention.
(g) New primary sources of energy were identified for power generation in addition
to the old ones.
i. Coal—the total reserves of coal was estimated to be 50,000 million tons.
ii. Lignite—the estimated reserve was estimated to be about 2000 million
tons.
iii. Hydropower.
iv. Uranium and thorium.
v. Oil and natural gas.
vi. Tidal power, wind power, geothermal power, and solar radiations.
2 Energy Sector Progression in India
Sector 1953-54, 39.9
Sector 1953-54, 43.7
Sector 1953-54, 9.6
Sector 1953-54, 0.5
Sector 1953-54, 1.4
Sector 1953-54, 0.5
Sector 1953-54, 2.9
Sector 1953-54, 1.5
Sector 1960-61, 41.5
Sector 1960-61, 40.2
Sector 1960-61, 9.7
Sector 1960-61, 0.3
Sector 1960-61, 1.6
Sector 1960-61, 0.3
Sector 1960-61, 4.7
Sector 1960-61, 1.7
Industry
Transport
Household
Commercial
Agriculture
Feedstocks
Non-energy use
Others
Fig. 2.15 Percentage share in final commercial energy consumption by different sectors (Source
Planning Commission 1970)
2.3 Part II—The Nuclear Energy Phase
2.3.1 The Third (1961–1966), Fourth (1969–1974), and Fifth
(1974–1978) Five-Year Plans
2.3.1.1 Highlights
(a) Focus on development of efficient small-scale industries in towns and rural areas
for improving employment opportunities and living standards.
(b) Reduced efficiency of thermal power stations due to aging process (the overall
efficiency of thermal power stations in 1959–1960 was only 19.5%).
(c) Crude oil and natural gas production were abysmally low, being 8.4 million tons
and 2.4 billion cubic meters in 1975–1976, respectively.
(d) 13.6 million tons of crude was imported in 1975–1976.
(e) Focus of rural electrification continued for energizing tube wells and pump
sets. An ambitious target of energizing 81,000 additional villages and 1,300,000
additional pump sets was set.
(f) Decline in fuelwood availability and sensitivity toward environmental issues
attracted public attention.
(g) New primary sources of energy were identified for power generation in addition
to the old ones.
i. Coal—the total reserves of coal was estimated to be 50,000 million tons.
ii. Lignite—the estimated reserve was estimated to be about 2000 million
tons.
iii. Hydropower.
iv. Uranium and thorium.
v. Oil and natural gas.
vi. Tidal power, wind power, geothermal power, and solar radiations.