

2.3 Part II—The Nuclear Energy Phase
49
0
10
20
30
40
50
60
1953-54
1960-61
1970-71
1980-81
Industrial
Transport
Household
Agriculture
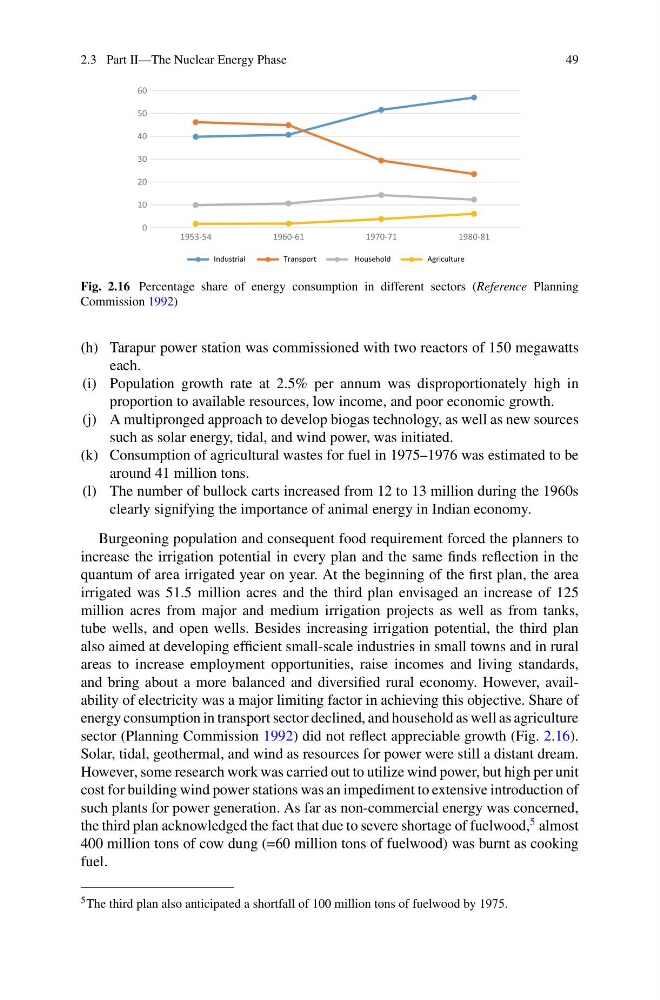
Fig. 2.16 Percentage share of energy consumption in different sectors (Reference Planning
Commission 1992)
(h) Tarapur power station was commissioned with two reactors of 150 megawatts
each.
(i) Population growth rate at 2.5% per annum was disproportionately high in
proportion to available resources, low income, and poor economic growth.
(j) A multipronged approach to develop biogas technology, as well as new sources
such as solar energy, tidal, and wind power, was initiated.
(k) Consumption of agricultural wastes for fuel in 1975–1976 was estimated to be
around 41 million tons.
(l) The number of bullock carts increased from 12 to 13 million during the 1960s
clearly signifying the importance of animal energy in Indian economy.
Burgeoning population and consequent food requirement forced the planners to
increase the irrigation potential in every plan and the same finds reflection in the
quantum of area irrigated year on year. At the beginning of the first plan, the area
irrigated was 51.5 million acres and the third plan envisaged an increase of 125
million acres from major and medium irrigation projects as well as from tanks,
tube wells, and open wells. Besides increasing irrigation potential, the third plan
also aimed at developing efficient small-scale industries in small towns and in rural
areas to increase employment opportunities, raise incomes and living standards,
and bring about a more balanced and diversified rural economy. However, availability of electricity was a major limiting factor in achieving this objective. Share of
energy consumption in transport sector declined, and household as well as agriculture
sector (Planning Commission 1992) did not reflect appreciable growth (Fig. 2.16).
Solar, tidal, geothermal, and wind as resources for power were still a distant dream.
However, some research work was carried out to utilize wind power, but high per unit
cost for building wind power stations was an impediment to extensive introduction of
such plants for power generation. As far as non-commercial energy was concerned,
the third plan acknowledged the fact that due to severe shortage of fuelwood,
5 almost
400 million tons of cow dung (=60 million tons of fuelwood) was burnt as cooking
fuel.
5 The third plan also anticipated a shortfall of 100 million tons of fuelwood by 1975.
49
0
10
20
30
40
50
60
1953-54
1960-61
1970-71
1980-81
Industrial
Transport
Household
Agriculture
Fig. 2.16 Percentage share of energy consumption in different sectors (Reference Planning
Commission 1992)
(h) Tarapur power station was commissioned with two reactors of 150 megawatts
each.
(i) Population growth rate at 2.5% per annum was disproportionately high in
proportion to available resources, low income, and poor economic growth.
(j) A multipronged approach to develop biogas technology, as well as new sources
such as solar energy, tidal, and wind power, was initiated.
(k) Consumption of agricultural wastes for fuel in 1975–1976 was estimated to be
around 41 million tons.
(l) The number of bullock carts increased from 12 to 13 million during the 1960s
clearly signifying the importance of animal energy in Indian economy.
Burgeoning population and consequent food requirement forced the planners to
increase the irrigation potential in every plan and the same finds reflection in the
quantum of area irrigated year on year. At the beginning of the first plan, the area
irrigated was 51.5 million acres and the third plan envisaged an increase of 125
million acres from major and medium irrigation projects as well as from tanks,
tube wells, and open wells. Besides increasing irrigation potential, the third plan
also aimed at developing efficient small-scale industries in small towns and in rural
areas to increase employment opportunities, raise incomes and living standards,
and bring about a more balanced and diversified rural economy. However, availability of electricity was a major limiting factor in achieving this objective. Share of
energy consumption in transport sector declined, and household as well as agriculture
sector (Planning Commission 1992) did not reflect appreciable growth (Fig. 2.16).
Solar, tidal, geothermal, and wind as resources for power were still a distant dream.
However, some research work was carried out to utilize wind power, but high per unit
cost for building wind power stations was an impediment to extensive introduction of
such plants for power generation. As far as non-commercial energy was concerned,
the third plan acknowledged the fact that due to severe shortage of fuelwood,
5 almost
400 million tons of cow dung (=60 million tons of fuelwood) was burnt as cooking
fuel.
5 The third plan also anticipated a shortfall of 100 million tons of fuelwood by 1975.