

2.2 Part I (The Initial Phase—Coal, Oil, and Water)
47
Nangal (Punjab)
48,000 kW
Bokaro (Bihar)
150,000 kW
Chola (Kalyan, Bombay)
54,000 kW
Khaperkheda (Madhya Pradesh)
30,000 kW
Moyar (Madras)
36,000 kW
Madras City Plant Extensions (Madras)
30,000 kW
Machkund (Andhra and Orissa)
34,000 kW
Pathri (UƩar Pradesh)
13,600 kW
Sarda (UƩar Pradesh)
27,600 kW
Sengulam (Travancore-Cochin)
48,000 kW
Joe (Mysore)
72,000 kW
Fig. 2.13 Completed power projects by the end of first plan (Planning Commission 1953)
5.65
20123
16644
10.17
36825
30366
INSTALLED GENERATING CAPACITY
ELECTRICITY GENERATED DURING THE YEAR
ELECTRICTY CONSUMED DURING THE YEAR
1960-61
1965-66
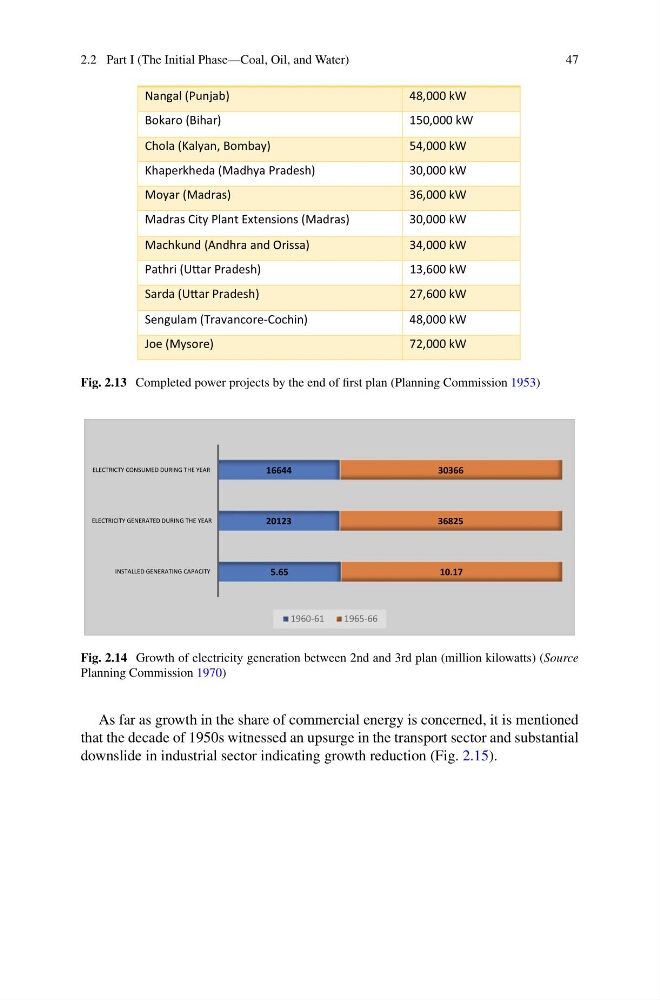
Fig. 2.14 Growth of electricity generation between 2nd and 3rd plan (million kilowatts) (Source
Planning Commission 1970)
As far as growth in the share of commercial energy is concerned, it is mentioned
that the decade of 1950s witnessed an upsurge in the transport sector and substantial
downslide in industrial sector indicating growth reduction (Fig. 2.15).
47
Nangal (Punjab)
48,000 kW
Bokaro (Bihar)
150,000 kW
Chola (Kalyan, Bombay)
54,000 kW
Khaperkheda (Madhya Pradesh)
30,000 kW
Moyar (Madras)
36,000 kW
Madras City Plant Extensions (Madras)
30,000 kW
Machkund (Andhra and Orissa)
34,000 kW
Pathri (UƩar Pradesh)
13,600 kW
Sarda (UƩar Pradesh)
27,600 kW
Sengulam (Travancore-Cochin)
48,000 kW
Joe (Mysore)
72,000 kW
Fig. 2.13 Completed power projects by the end of first plan (Planning Commission 1953)
5.65
20123
16644
10.17
36825
30366
INSTALLED GENERATING CAPACITY
ELECTRICITY GENERATED DURING THE YEAR
ELECTRICTY CONSUMED DURING THE YEAR
1960-61
1965-66
Fig. 2.14 Growth of electricity generation between 2nd and 3rd plan (million kilowatts) (Source
Planning Commission 1970)
As far as growth in the share of commercial energy is concerned, it is mentioned
that the decade of 1950s witnessed an upsurge in the transport sector and substantial
downslide in industrial sector indicating growth reduction (Fig. 2.15).