

44
2 Energy Sector Progression in India
Despite high consumption of energy in the industrial sector, there was hardly
any reduction in the workforce for agriculture sector as the first plan progressed.
The second plan took cognizance of this situation and acknowledged the fact that
workforce had to be shifted from agriculture to industrial sector without any relaxation in efforts to increase food productivity. It also recognized that development of
power was vital for both agriculture as well as industrial sector, particularly for the
development of basic and heavy industries, oil and coal exploration, and development of atomic energy. It emphasized the need for enhancing hydropower potential
to 35 million kilowatts of which 20 million kilowatts was expected from the Ganges,
Brahmaputra, Indus, and other Himalayan rivers in the northern and north-eastern
regions, 7 million kilowatts from the east-flowing rivers of the southern region, 4
million kilowatts from the Narmada, Tapti, Mahanadi, Brahmini, and Baitami basins
in the central region, and 4 million kilowatts from the west-flowing rivers.
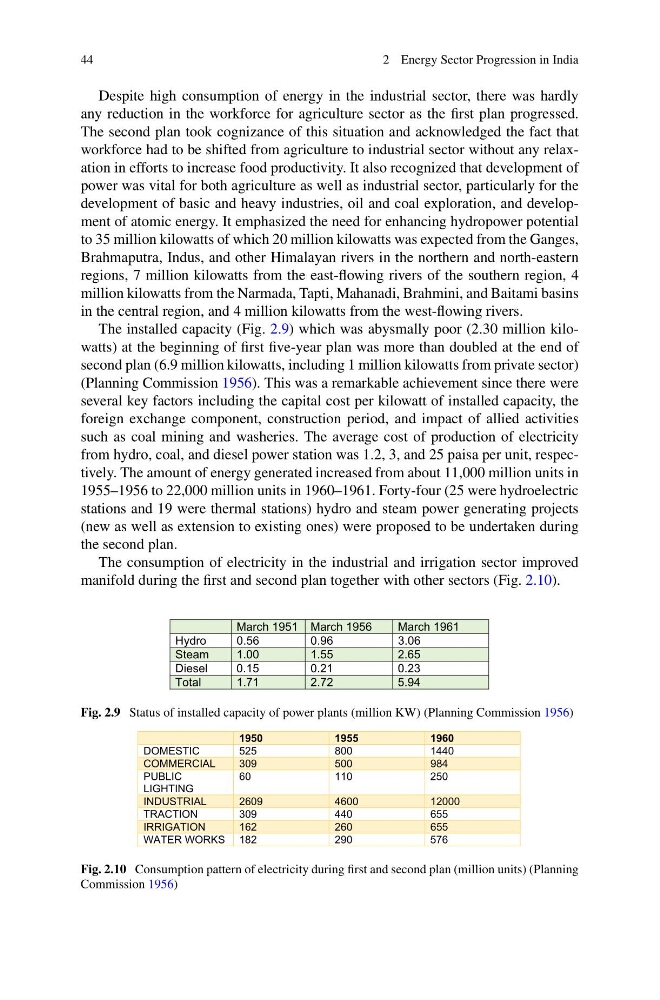
The installed capacity (Fig. 2.9) which was abysmally poor (2.30 million kilowatts) at the beginning of first five-year plan was more than doubled at the end of
second plan (6.9 million kilowatts, including 1 million kilowatts from private sector)
(Planning Commission 1956). This was a remarkable achievement since there were
several key factors including the capital cost per kilowatt of installed capacity, the
foreign exchange component, construction period, and impact of allied activities
such as coal mining and washeries. The average cost of production of electricity
from hydro, coal, and diesel power station was 1.2, 3, and 25 paisa per unit, respectively. The amount of energy generated increased from about 11,000 million units in
1955–1956 to 22,000 million units in 1960–1961. Forty-four (25 were hydroelectric
stations and 19 were thermal stations) hydro and steam power generating projects
(new as well as extension to existing ones) were proposed to be undertaken during
the second plan.
The consumption of electricity in the industrial and irrigation sector improved
manifold during the first and second plan together with other sectors (Fig. 2.10).
March 1951 March 1956
March 1961
Hydro
0.56
0.96
3.06
Steam
1.00
1.55
2.65
Diesel
0.15
0.21
0.23
Total
1.71
2.72
5.94
Fig. 2.9 Status of installed capacity of power plants (million KW) (Planning Commission 1956)
1950
1955
1960
DOMESTIC
525
800
1440
COMMERCIAL
309
500
984
PUBLIC
LIGHTING
60
110
250
INDUSTRIAL
2609
4600
12000
TRACTION
309
440
655
IRRIGATION
162
260
655
WATER WORKS 182
290
576
Fig. 2.10 Consumption pattern of electricity during first and second plan (million units) (Planning
Commission 1956)
2 Energy Sector Progression in India
Despite high consumption of energy in the industrial sector, there was hardly
any reduction in the workforce for agriculture sector as the first plan progressed.
The second plan took cognizance of this situation and acknowledged the fact that
workforce had to be shifted from agriculture to industrial sector without any relaxation in efforts to increase food productivity. It also recognized that development of
power was vital for both agriculture as well as industrial sector, particularly for the
development of basic and heavy industries, oil and coal exploration, and development of atomic energy. It emphasized the need for enhancing hydropower potential
to 35 million kilowatts of which 20 million kilowatts was expected from the Ganges,
Brahmaputra, Indus, and other Himalayan rivers in the northern and north-eastern
regions, 7 million kilowatts from the east-flowing rivers of the southern region, 4
million kilowatts from the Narmada, Tapti, Mahanadi, Brahmini, and Baitami basins
in the central region, and 4 million kilowatts from the west-flowing rivers.
The installed capacity (Fig. 2.9) which was abysmally poor (2.30 million kilowatts) at the beginning of first five-year plan was more than doubled at the end of
second plan (6.9 million kilowatts, including 1 million kilowatts from private sector)
(Planning Commission 1956). This was a remarkable achievement since there were
several key factors including the capital cost per kilowatt of installed capacity, the
foreign exchange component, construction period, and impact of allied activities
such as coal mining and washeries. The average cost of production of electricity
from hydro, coal, and diesel power station was 1.2, 3, and 25 paisa per unit, respectively. The amount of energy generated increased from about 11,000 million units in
1955–1956 to 22,000 million units in 1960–1961. Forty-four (25 were hydroelectric
stations and 19 were thermal stations) hydro and steam power generating projects
(new as well as extension to existing ones) were proposed to be undertaken during
the second plan.
The consumption of electricity in the industrial and irrigation sector improved
manifold during the first and second plan together with other sectors (Fig. 2.10).
March 1951 March 1956
March 1961
Hydro
0.56
0.96
3.06
Steam
1.00
1.55
2.65
Diesel
0.15
0.21
0.23
Total
1.71
2.72
5.94
Fig. 2.9 Status of installed capacity of power plants (million KW) (Planning Commission 1956)
1950
1955
1960
DOMESTIC
525
800
1440
COMMERCIAL
309
500
984
PUBLIC
LIGHTING
60
110
250
INDUSTRIAL
2609
4600
12000
TRACTION
309
440
655
IRRIGATION
162
260
655
WATER WORKS 182
290
576
Fig. 2.10 Consumption pattern of electricity during first and second plan (million units) (Planning
Commission 1956)