

2.2 Part I (The Initial Phase—Coal, Oil, and Water)
45
Population of
Town/village
1950-5I
1955-56
1961
Total number
according to
1941 census
Number
electrified as on
March 1951
Total number
according to
1951 census
Number
electrified
by March
1956
Number electrified
by March,1961
Over 1,00,000
49
49
73
73
73
50,000 lo 1,00,000
88
88
111
111
111
20,000 to 50,000
277
240
401
366
399
10,000 to 20,000
607
260
856
350
756
5,000 to 10,000
2367
258
3101
1200
1800
Less than 5,000
559062
2792
556565
5300
19861
Total
562450
3687
561107
7400
23030
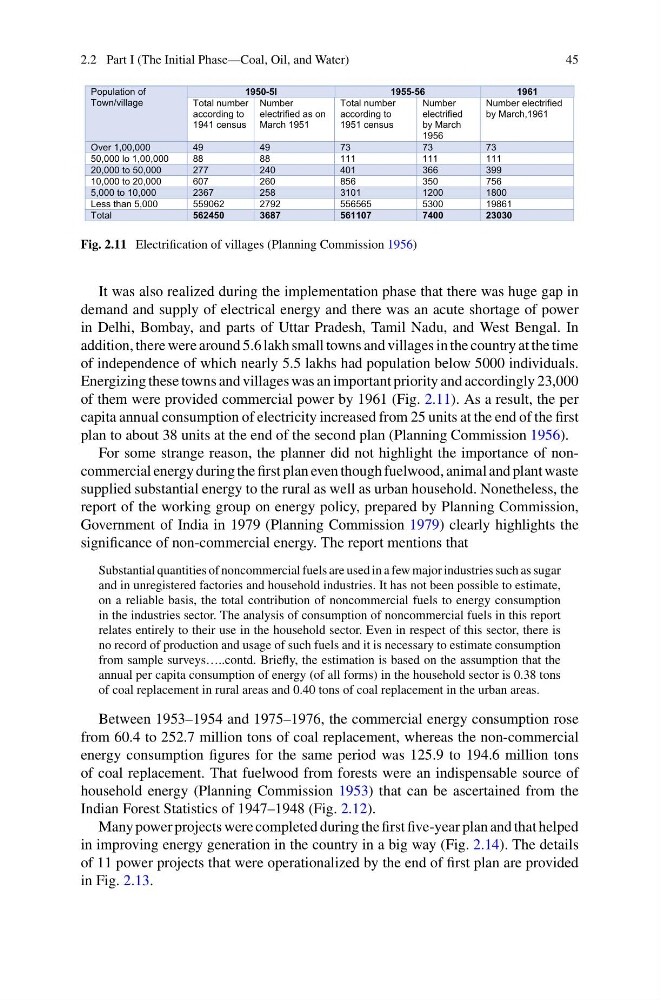
Fig. 2.11 Electrification of villages (Planning Commission 1956)
It was also realized during the implementation phase that there was huge gap in
demand and supply of electrical energy and there was an acute shortage of power
in Delhi, Bombay, and parts of Uttar Pradesh, Tamil Nadu, and West Bengal. In
addition, there were around 5.6 lakh small towns and villages in the country at the time
of independence of which nearly 5.5 lakhs had population below 5000 individuals.
Energizing these towns and villages was an important priority and accordingly 23,000
of them were provided commercial power by 1961 (Fig. 2.11). As a result, the per
capita annual consumption of electricity increased from 25 units at the end of the first
plan to about 38 units at the end of the second plan (Planning Commission 1956).
For some strange reason, the planner did not highlight the importance of noncommercial energy during the first plan even though fuelwood, animal and plant waste
supplied substantial energy to the rural as well as urban household. Nonetheless, the
report of the working group on energy policy, prepared by Planning Commission,
Government of India in 1979 (Planning Commission 1979) clearly highlights the
significance of non-commercial energy. The report mentions that
Substantial quantities of noncommercial fuels are used in a few major industries such as sugar
and in unregistered factories and household industries. It has not been possible to estimate,
on a reliable basis, the total contribution of noncommercial fuels to energy consumption
in the industries sector. The analysis of consumption of noncommercial fuels in this report
relates entirely to their use in the household sector. Even in respect of this sector, there is
no record of production and usage of such fuels and it is necessary to estimate consumption
from sample surveys…..contd. Briefly, the estimation is based on the assumption that the
annual per capita consumption of energy (of all forms) in the household sector is 0.38 tons
of coal replacement in rural areas and 0.40 tons of coal replacement in the urban areas.
Between 1953–1954 and 1975–1976, the commercial energy consumption rose
from 60.4 to 252.7 million tons of coal replacement, whereas the non-commercial
energy consumption figures for the same period was 125.9 to 194.6 million tons
of coal replacement. That fuelwood from forests were an indispensable source of
household energy (Planning Commission 1953) that can be ascertained from the
Indian Forest Statistics of 1947–1948 (Fig. 2.12).
Many power projects were completed during the first five-year plan and that helped
in improving energy generation in the country in a big way (Fig. 2.14). The details
of 11 power projects that were operationalized by the end of first plan are provided
in Fig. 2.13.
45
Population of
Town/village
1950-5I
1955-56
1961
Total number
according to
1941 census
Number
electrified as on
March 1951
Total number
according to
1951 census
Number
electrified
by March
1956
Number electrified
by March,1961
Over 1,00,000
49
49
73
73
73
50,000 lo 1,00,000
88
88
111
111
111
20,000 to 50,000
277
240
401
366
399
10,000 to 20,000
607
260
856
350
756
5,000 to 10,000
2367
258
3101
1200
1800
Less than 5,000
559062
2792
556565
5300
19861
Total
562450
3687
561107
7400
23030
Fig. 2.11 Electrification of villages (Planning Commission 1956)
It was also realized during the implementation phase that there was huge gap in
demand and supply of electrical energy and there was an acute shortage of power
in Delhi, Bombay, and parts of Uttar Pradesh, Tamil Nadu, and West Bengal. In
addition, there were around 5.6 lakh small towns and villages in the country at the time
of independence of which nearly 5.5 lakhs had population below 5000 individuals.
Energizing these towns and villages was an important priority and accordingly 23,000
of them were provided commercial power by 1961 (Fig. 2.11). As a result, the per
capita annual consumption of electricity increased from 25 units at the end of the first
plan to about 38 units at the end of the second plan (Planning Commission 1956).
For some strange reason, the planner did not highlight the importance of noncommercial energy during the first plan even though fuelwood, animal and plant waste
supplied substantial energy to the rural as well as urban household. Nonetheless, the
report of the working group on energy policy, prepared by Planning Commission,
Government of India in 1979 (Planning Commission 1979) clearly highlights the
significance of non-commercial energy. The report mentions that
Substantial quantities of noncommercial fuels are used in a few major industries such as sugar
and in unregistered factories and household industries. It has not been possible to estimate,
on a reliable basis, the total contribution of noncommercial fuels to energy consumption
in the industries sector. The analysis of consumption of noncommercial fuels in this report
relates entirely to their use in the household sector. Even in respect of this sector, there is
no record of production and usage of such fuels and it is necessary to estimate consumption
from sample surveys…..contd. Briefly, the estimation is based on the assumption that the
annual per capita consumption of energy (of all forms) in the household sector is 0.38 tons
of coal replacement in rural areas and 0.40 tons of coal replacement in the urban areas.
Between 1953–1954 and 1975–1976, the commercial energy consumption rose
from 60.4 to 252.7 million tons of coal replacement, whereas the non-commercial
energy consumption figures for the same period was 125.9 to 194.6 million tons
of coal replacement. That fuelwood from forests were an indispensable source of
household energy (Planning Commission 1953) that can be ascertained from the
Indian Forest Statistics of 1947–1948 (Fig. 2.12).
Many power projects were completed during the first five-year plan and that helped
in improving energy generation in the country in a big way (Fig. 2.14). The details
of 11 power projects that were operationalized by the end of first plan are provided
in Fig. 2.13.