

1.3 The Paradox of Energy Security and Sustainability
17
for countries that had high import dependence, this criterion had little relevance.
Acceptability of nuclear energy was another serious concern.
5. Substitution—possibilities of substitution of oil, gas, and coal to hydro, nuclear,
and solar energy. The fact that substitution requires large investments with long
gestation period which developing and underdeveloped countries could ill afford.
For example, the hydropower development was deferred in many countries due to
high capital cost, environmental issues, riparian state conflicts, and so on. Silent
valley project in India is a glaring example of cancellation of hydroelectric project
in favor of biodiversity conservation.
6. Uncertainty on the future economic growth of the industrialized countries was
the most crucial factor for certainty/uncertainties on the demand side. Most of the
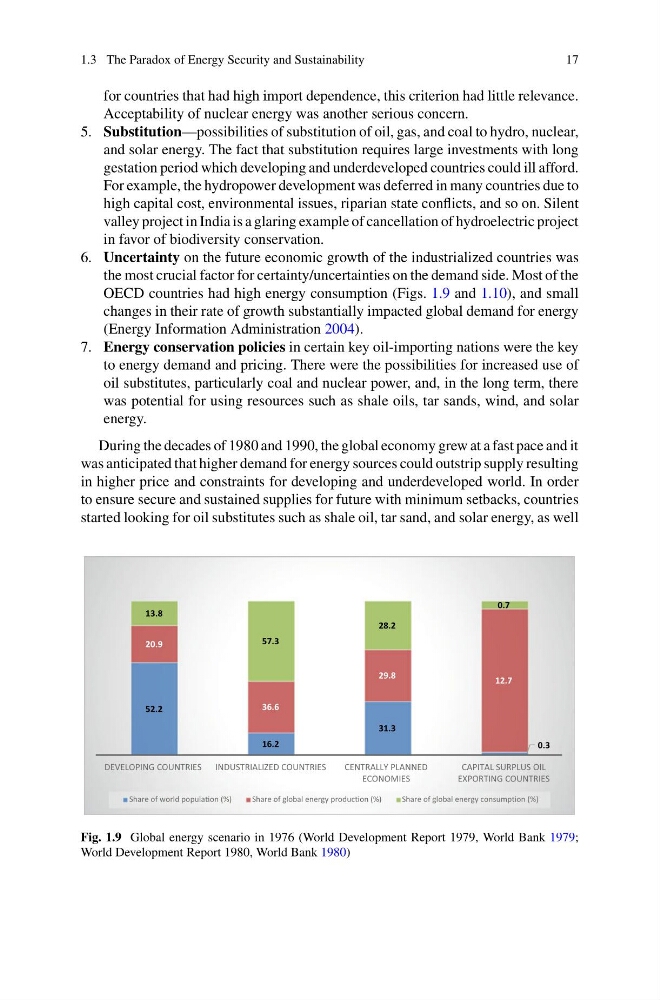
OECD countries had high energy consumption (Figs. 1.9 and 1.10), and small
changes in their rate of growth substantially impacted global demand for energy
(Energy Information Administration 2004).
7. Energy conservation policies in certain key oil-importing nations were the key
to energy demand and pricing. There were the possibilities for increased use of
oil substitutes, particularly coal and nuclear power, and, in the long term, there
was potential for using resources such as shale oils, tar sands, wind, and solar
energy.
During the decades of 1980 and 1990, the global economy grew at a fast pace and it
was anticipated that higher demand for energy sources could outstrip supply resulting
in higher price and constraints for developing and underdeveloped world. In order
to ensure secure and sustained supplies for future with minimum setbacks, countries
started looking for oil substitutes such as shale oil, tar sand, and solar energy, as well
52.2
16.2
31.3
0.3
20.9
36.6
29.8
12.7
13.8
57.3
28.2
0.7
DEVELOPING COUNTRIES INDUSTRIALIZED COUNTRIES
CENTRALLY PLANNED
ECONOMIES
CAPITAL SURPLUS OIL
EXPORTING COUNTRIES
Share of world populaƟon (%)
Share of global energy production (%)
Share of global energy consumption (%)
Fig. 1.9 Global energy scenario in 1976 (World Development Report 1979, World Bank 1979;
World Development Report 1980, World Bank 1980)
17
for countries that had high import dependence, this criterion had little relevance.
Acceptability of nuclear energy was another serious concern.
5. Substitution—possibilities of substitution of oil, gas, and coal to hydro, nuclear,
and solar energy. The fact that substitution requires large investments with long
gestation period which developing and underdeveloped countries could ill afford.
For example, the hydropower development was deferred in many countries due to
high capital cost, environmental issues, riparian state conflicts, and so on. Silent
valley project in India is a glaring example of cancellation of hydroelectric project
in favor of biodiversity conservation.
6. Uncertainty on the future economic growth of the industrialized countries was
the most crucial factor for certainty/uncertainties on the demand side. Most of the
OECD countries had high energy consumption (Figs. 1.9 and 1.10), and small
changes in their rate of growth substantially impacted global demand for energy
(Energy Information Administration 2004).
7. Energy conservation policies in certain key oil-importing nations were the key
to energy demand and pricing. There were the possibilities for increased use of
oil substitutes, particularly coal and nuclear power, and, in the long term, there
was potential for using resources such as shale oils, tar sands, wind, and solar
energy.
During the decades of 1980 and 1990, the global economy grew at a fast pace and it
was anticipated that higher demand for energy sources could outstrip supply resulting
in higher price and constraints for developing and underdeveloped world. In order
to ensure secure and sustained supplies for future with minimum setbacks, countries
started looking for oil substitutes such as shale oil, tar sand, and solar energy, as well
52.2
16.2
31.3
0.3
20.9
36.6
29.8
12.7
13.8
57.3
28.2
0.7
DEVELOPING COUNTRIES INDUSTRIALIZED COUNTRIES
CENTRALLY PLANNED
ECONOMIES
CAPITAL SURPLUS OIL
EXPORTING COUNTRIES
Share of world populaƟon (%)
Share of global energy production (%)
Share of global energy consumption (%)
Fig. 1.9 Global energy scenario in 1976 (World Development Report 1979, World Bank 1979;
World Development Report 1980, World Bank 1980)