

168
5 Fourth Industrial Revolution and India
[Source -Plan. Comm., 2008]
[Source Plan. Comm., 2015]
Capital Cost
(INR in Crore
per MW)
Estimated Cost of
Generation per
Unit (Rs per kWh)
Capital Cost (INR
in Crore per MW)
Estimated Cost of
Generation per Unit
(Rs per kWh)
Small hydropower
5.00 – 6.00
1.50 – 2.50
5.50 – 7.70
3.54 – 4.88
Wind power
4.00 – 5.00
2.00 – 3.00
5.75
3.73 – 5.96
Biomass power
4
2.50 – 3.50
4.0 – 4.45
5.12 – 5.83
Bagasse co-generation
3.5
2.50 – 3.00
4.2
4.61 – 5.73
Biomass gasifier
1.94
2.50 – 3.50
Solar photovoltaic
26.5
15.00 – 20.00
10.00–13.00
10.39 –12.46
Energy from waste
2.50 –10.0
2.50 – 7.50
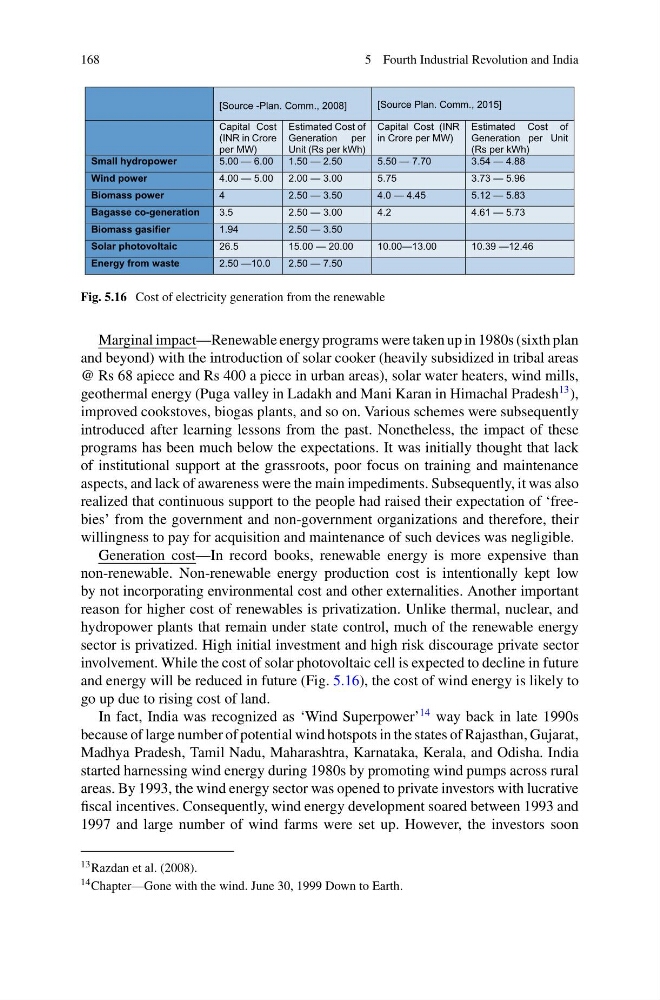
Fig. 5.16 Cost of electricity generation from the renewable
Marginal impact—Renewable energy programs were taken up in 1980s (sixth plan
and beyond) with the introduction of solar cooker (heavily subsidized in tribal areas
@ Rs 68 apiece and Rs 400 a piece in urban areas), solar water heaters, wind mills,
geothermal energy (Puga valley in Ladakh and Mani Karan in Himachal Pradesh
13 ),
improved cookstoves, biogas plants, and so on. Various schemes were subsequently
introduced after learning lessons from the past. Nonetheless, the impact of these
programs has been much below the expectations. It was initially thought that lack
of institutional support at the grassroots, poor focus on training and maintenance
aspects, and lack of awareness were the main impediments. Subsequently, it was also
realized that continuous support to the people had raised their expectation of ‘freebies’ from the government and non-government organizations and therefore, their
willingness to pay for acquisition and maintenance of such devices was negligible.
Generation cost—In record books, renewable energy is more expensive than
non-renewable. Non-renewable energy production cost is intentionally kept low
by not incorporating environmental cost and other externalities. Another important
reason for higher cost of renewables is privatization. Unlike thermal, nuclear, and
hydropower plants that remain under state control, much of the renewable energy
sector is privatized. High initial investment and high risk discourage private sector
involvement. While the cost of solar photovoltaic cell is expected to decline in future
and energy will be reduced in future (Fig. 5.16), the cost of wind energy is likely to
go up due to rising cost of land.
In fact, India was recognized as ‘Wind Superpower’
14 way back in late 1990s
because of large number of potential wind hotspots in the states of Rajasthan, Gujarat,
Madhya Pradesh, Tamil Nadu, Maharashtra, Karnataka, Kerala, and Odisha. India
started harnessing wind energy during 1980s by promoting wind pumps across rural
areas. By 1993, the wind energy sector was opened to private investors with lucrative
fiscal incentives. Consequently, wind energy development soared between 1993 and
1997 and large number of wind farms were set up. However, the investors soon
13 Razdan et al. (2008).
14 Chapter—Gone with the wind. June 30, 1999 Down to Earth.
5 Fourth Industrial Revolution and India
[Source -Plan. Comm., 2008]
[Source Plan. Comm., 2015]
Capital Cost
(INR in Crore
per MW)
Estimated Cost of
Generation per
Unit (Rs per kWh)
Capital Cost (INR
in Crore per MW)
Estimated Cost of
Generation per Unit
(Rs per kWh)
Small hydropower
5.00 – 6.00
1.50 – 2.50
5.50 – 7.70
3.54 – 4.88
Wind power
4.00 – 5.00
2.00 – 3.00
5.75
3.73 – 5.96
Biomass power
4
2.50 – 3.50
4.0 – 4.45
5.12 – 5.83
Bagasse co-generation
3.5
2.50 – 3.00
4.2
4.61 – 5.73
Biomass gasifier
1.94
2.50 – 3.50
Solar photovoltaic
26.5
15.00 – 20.00
10.00–13.00
10.39 –12.46
Energy from waste
2.50 –10.0
2.50 – 7.50
Fig. 5.16 Cost of electricity generation from the renewable
Marginal impact—Renewable energy programs were taken up in 1980s (sixth plan
and beyond) with the introduction of solar cooker (heavily subsidized in tribal areas
@ Rs 68 apiece and Rs 400 a piece in urban areas), solar water heaters, wind mills,
geothermal energy (Puga valley in Ladakh and Mani Karan in Himachal Pradesh
13 ),
improved cookstoves, biogas plants, and so on. Various schemes were subsequently
introduced after learning lessons from the past. Nonetheless, the impact of these
programs has been much below the expectations. It was initially thought that lack
of institutional support at the grassroots, poor focus on training and maintenance
aspects, and lack of awareness were the main impediments. Subsequently, it was also
realized that continuous support to the people had raised their expectation of ‘freebies’ from the government and non-government organizations and therefore, their
willingness to pay for acquisition and maintenance of such devices was negligible.
Generation cost—In record books, renewable energy is more expensive than
non-renewable. Non-renewable energy production cost is intentionally kept low
by not incorporating environmental cost and other externalities. Another important
reason for higher cost of renewables is privatization. Unlike thermal, nuclear, and
hydropower plants that remain under state control, much of the renewable energy
sector is privatized. High initial investment and high risk discourage private sector
involvement. While the cost of solar photovoltaic cell is expected to decline in future
and energy will be reduced in future (Fig. 5.16), the cost of wind energy is likely to
go up due to rising cost of land.
In fact, India was recognized as ‘Wind Superpower’
14 way back in late 1990s
because of large number of potential wind hotspots in the states of Rajasthan, Gujarat,
Madhya Pradesh, Tamil Nadu, Maharashtra, Karnataka, Kerala, and Odisha. India
started harnessing wind energy during 1980s by promoting wind pumps across rural
areas. By 1993, the wind energy sector was opened to private investors with lucrative
fiscal incentives. Consequently, wind energy development soared between 1993 and
1997 and large number of wind farms were set up. However, the investors soon
13 Razdan et al. (2008).
14 Chapter—Gone with the wind. June 30, 1999 Down to Earth.